










Happiest Minds United States revenue share falls to 56.3% Q2 FY27
Key highlights
- Happiest Minds' United States revenue share was 56.3% in Q2 FY27, down from 70.7% in FY24.
- Fixed-price contracts represented 31.7% of Q2 FY27 revenue, up from 26.1% in FY24.
- BFSI contributed 27.7% of Q2 FY27 revenue, compared with 10.9% in FY24.
- Happiest Minds had 311 active customers in Q2 FY27, up from 250 in FY24.
powered by IRIS
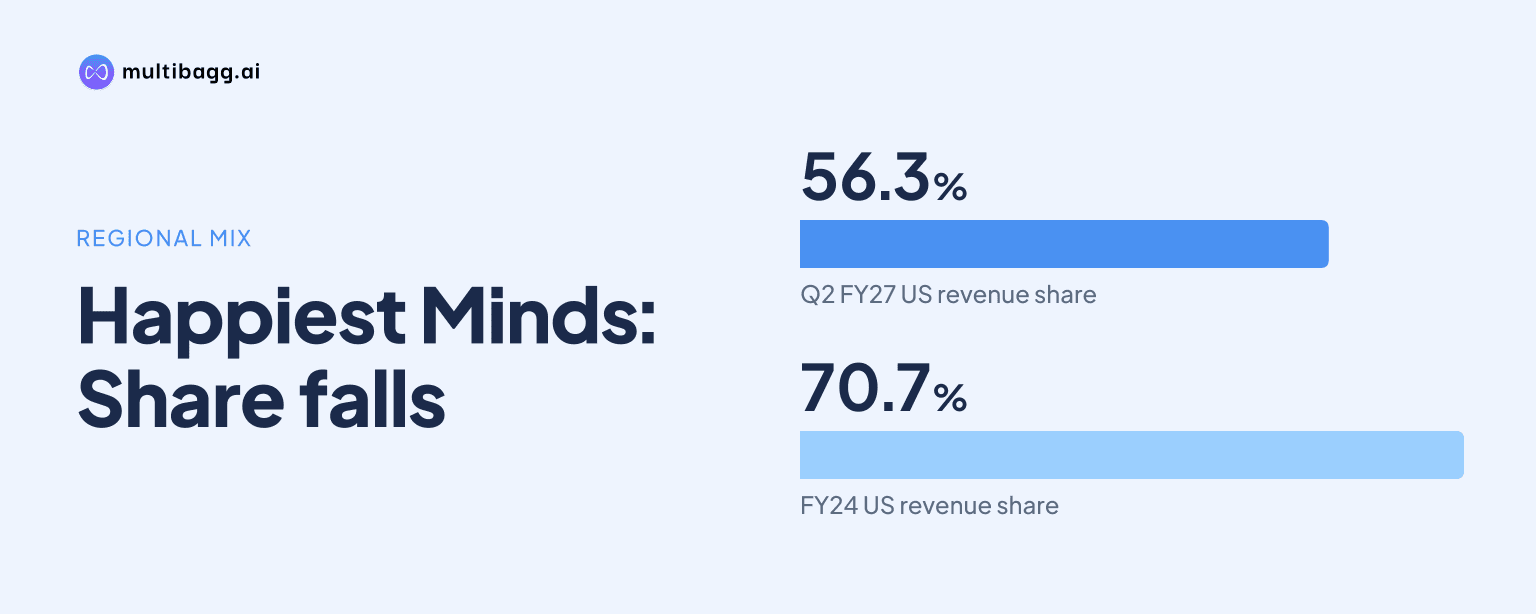
In the second quarter of financial year 2027 (Q2 FY27), Happiest Minds reported that the United States, labelled Americas in its revenue summary, represented 56.3% of revenue, down from 70.7% in financial year 2024 (FY24), while fixed-price contracts reached 31.7% from 26.1%.
Know Happiest Minds Technologies inside out
Results, valuation, peers and who's buying, in one view.
How has Happiest Minds' geographic revenue mix changed?
Happiest Minds' United States revenue share fell 14.4 percentage points from 70.7% in FY24 to 56.3% in Q2 FY27. The decline occurred across the reported periods, with the United States at 64.6% in FY25, 59.3% in FY26 and 56.9% in Q1 FY27. The revenue summary separately labels the 56.3% Q2 FY27 contribution as Americas, while the data sheet labels it USA.
India's contribution was 18.0% in Q2 FY27, compared with 16.3% in FY24 and 17.6% in FY26. Asia-Pacific (APAC), which was not separately shown in FY24, accounted for 5.3% in FY25, 7.2% in FY26 and 9.0% in Q2 FY27. Revenue from the rest of the world (ROW) increased from 4.1% in FY24 to 8.8% in Q2 FY27, whereas Europe moved from 8.9% to 7.8%.
Why did Happiest Minds' fixed-price contract share rise?
Happiest Minds' fixed-price revenue share reached 31.7% in Q2 FY27, up 5.6 percentage points from 26.1% in FY24 and 5.2 percentage points from 26.5% in FY26. Fixed-price work rose sequentially from 29.8% in Q4 FY26 to 30.8% in Q1 FY27 and then 31.7% in Q2 FY27. The presentation reports the change in mix but does not give a reason for the increase.
Time-and-material contracts remained the larger contracting model at 68.3% in Q2 FY27, but their share was down from 73.9% in FY24 and 73.5% in FY26. The mix shift was not limited to the latest quarter: fixed-price work was 24.1% in FY25, before increasing to 28.5% in Q3 FY26 and 29.8% in Q4 FY26. The two contract models totalled 100.0% in each reported period.
Got a follow-up? Ask IRIS
Which customer industries are contributing more revenue to Happiest Minds?
Happiest Minds' banking, financial services and insurance (BFSI) vertical was its largest reported industry vertical in Q2 FY27, contributing 27.7% of revenue. BFSI was 10.9% in FY24 and 26.1% in FY26, and it rose from 26.8% in Q1 FY27. Healthcare ranked second at 17.8% in Q2 FY27, followed by education technology at 15.4%.
The industry mix shifted across several categories between FY24 and Q2 FY27. Education technology declined from 23.9% to 15.4%, while manufacturing declined from 6.3% to 1.6%. Healthcare increased from 14.4% to 17.8%, and retail and consumer packaged goods (CPG) increased from 7.4% to 9.7%.
BFSI's 16.8-percentage-point increase was the largest change among the listed verticals between FY24 and Q2 FY27. High technology represented 12.5% in Q2 FY27, below 14.5% in FY24, while travel, media and entertainment contributed 8.7%, down from 11.9%. Industrial represented 6.0% in Q2 FY27 compared with 7.5% in FY24.
What does Happiest Minds' service and customer mix show?
Happiest Minds' digital infrastructure and cloud offering remained its largest disclosed service category at 50.7% in Q2 FY27. Its share was below 53.1% in Q1 FY27 and 51.4% in FY25, but above 42.9% in FY24. Artificial intelligence (AI) and analytics accounted for 13.3% in Q2 FY27, matching its FY24 share and rising from 11.1% in FY26.
Software as a service (SaaS) contributed 20.6% in Q2 FY27, compared with 25.7% in FY24. Security solutions declined from 9.6% in FY24 to 5.8% in Q2 FY27, while Internet of Things (IoT) revenue declined from 4.4% to 0.7%. The disclosed digital service categories totalled 91.1% in Q2 FY27, compared with 95.9% in FY24.
Happiest Minds had 311 active customers in Q2 FY27, compared with 306 in FY26 and 250 in FY24. Average revenue per active customer was USD 875,000 in Q2 FY27, versus USD 864,000 in FY26 and USD 794,000 in FY24. Customers generating at least USD 1 million numbered 52 in Q2 FY27, unchanged from Q1 FY27 and FY26, but below the 57 reported in FY25.
Conclusion
Happiest Minds' Q2 FY27 data shows lower United States and time-and-material concentration than in FY24, alongside a changed industry and service mix. United States revenue was 56.3% versus 70.7% in FY24, fixed-price work was 31.7% versus 26.1%, and BFSI reached 27.7% versus 10.9%.
The presentation does not disclose a target, plan or scheduled event for the geographic or contracting mix after Q2 FY27. The key unresolved points in subsequent disclosures are whether fixed-price work remains above 30% after reaching 31.7%, and whether the count of USD 1 million customers changes from 52 as active customers rose to 311.