










HIRECT revenue nearly tripled but FY26 EBITDA margin fell
Key highlights
- HIRECT revenue from operations reached Rs 999.1 crore in FY26, up from Rs 372.4 crore in FY22.
- HIRECT’s FY26 EBITDA margin was 8.4%, compared with 10.7% in FY25.
- HIRECT reported FY26 PAT of Rs 38.6 crore, while PAT margin declined to 3.9% from 5.7%.
- HIRECT generated Rs 85.8 crore of operating cash flow in FY26, versus Rs 35.6 crore in FY25.
powered by IRIS
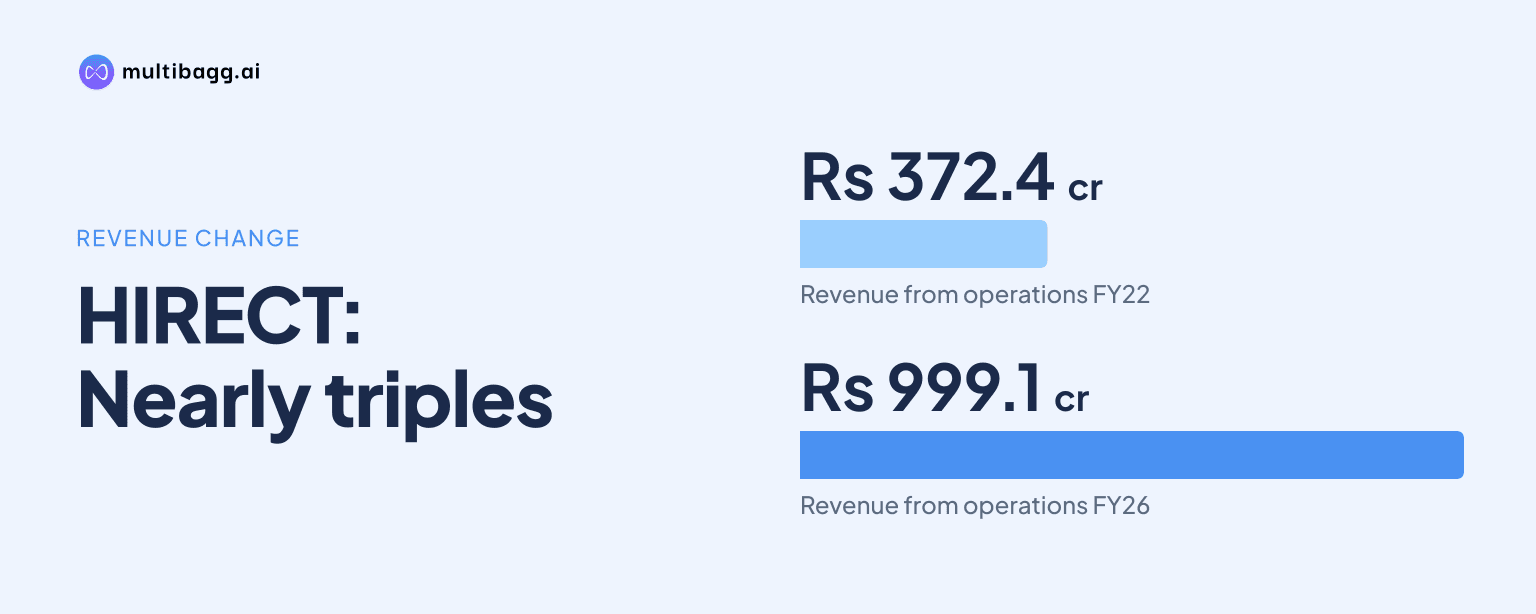
HIRECT reported revenue from operations of Rs 999.1 crore in FY26, compared with Rs 372.4 crore in FY22, but its EBITDA margin was 8.4%, below the FY25 level of 10.7%. The five-year accounts show substantially higher revenue and absolute profit, while gross, EBITDA and profit-after-tax margins did not expand consistently.
Know Hirect inside out
Results, valuation, peers and who's buying, in one view.
How much did HIRECT’s revenue grow from FY22 to FY26?
HIRECT’s revenue from operations increased to Rs 999.1 crore in FY26 from Rs 372.4 crore in FY22, after first declining to Rs 359.1 crore in FY23. Revenue then rose to Rs 517.6 crore in FY24 and Rs 655.4 crore in FY25, before increasing by Rs 343.7 crore in FY26.
Gross profit increased to Rs 263.1 crore in FY26 from Rs 84.1 crore in FY22, but the gross-profit margin moved unevenly over the period. The margin was 22.5% in FY22, fell to 22.1% in FY23, improved to 27.0% in FY25 and then declined by 0.7 percentage points to 26.3% in FY26 as cost of goods sold reached Rs 736.0 crore.
Why did HIRECT’s EBITDA margin decline in FY26?
HIRECT’s EBITDA, or earnings before interest, tax, depreciation and amortisation, rose by Rs 13.8 crore to Rs 84.1 crore in FY26, but its margin declined to 8.4% from 10.7% in FY25. Revenue increased by Rs 343.7 crore during the year, meaning EBITDA grew less quickly than sales.
Employee expenses increased to Rs 112.0 crore in FY26 from Rs 63.3 crore in FY25, while other expenses rose to Rs 67.0 crore from Rs 43.5 crore. These two operating-cost lines increased by Rs 72.2 crore, while gross profit increased by Rs 86.0 crore. The FY26 EBITDA margin remained above FY22’s 6.1%, FY23’s 4.3% and FY24’s 8.7%, but did not retain the FY25 peak.
What happened to HIRECT’s net profit margin?
HIRECT’s PAT increased to Rs 38.6 crore in FY26 from Rs 37.1 crore in FY25, while its PAT margin declined to 3.9% from 5.7%. The Rs 1.5 crore increase in net profit was smaller than the Rs 13.8 crore increase in EBITDA and the Rs 343.7 crore rise in revenue.
Profit before tax rose to Rs 53.9 crore in FY26 from Rs 50.1 crore in FY25, despite a Rs 2.0 crore exceptional item recorded in FY26. Depreciation increased to Rs 13.8 crore from Rs 8.5 crore, finance cost rose to Rs 16.0 crore from Rs 13.2 crore, and tax expense increased to Rs 15.3 crore from Rs 13.0 crore. The series also includes a Rs 6.3 crore loss in FY23 before profits of Rs 12.5 crore, Rs 37.1 crore and Rs 38.6 crore in the following three years.
Got a follow-up? Ask IRIS
Did HIRECT’s operating cash flow increase in FY26?
HIRECT generated Rs 85.8 crore of net cash from operating activities in FY26, compared with Rs 35.6 crore in FY25. Cash generated from operations was Rs 99.0 crore before direct taxes of Rs 13.2 crore, while the working-capital movement was a positive Rs 1.8 crore.
The FY26 outcome differed from FY25, when working-capital changes used Rs 42.2 crore and net operating cash was Rs 35.6 crore. Operating profit before working-capital changes increased to Rs 97.2 crore from Rs 85.8 crore. However, net cash used in investing activities increased to Rs 90.3 crore in FY26 from Rs 25.3 crore in FY25, leaving cash and cash equivalents of Rs 4.8 crore at year-end, compared with Rs 1.1 crore a year earlier.
How did HIRECT’s balance sheet change by September 2026?
HIRECT’s total assets increased to Rs 716.9 crore at September 2026 from Rs 662.1 crore at March 2026, while total equity rose to Rs 311.9 crore from Rs 205.8 crore. Cash and cash equivalents were Rs 63.7 crore at September 2026, compared with Rs 3.9 crore at March 2026.
Current assets were Rs 490.0 crore at September 2026, including inventory of Rs 185.0 crore and trade receivables of Rs 171.5 crore. Inventory increased from Rs 149.1 crore at March 2026, while receivables declined by Rs 74.9 crore from Rs 246.4 crore. Current borrowings decreased to Rs 175.7 crore from Rs 204.2 crore, and non-current borrowings fell to Rs 24.8 crore from Rs 32.5 crore.
Conclusion
HIRECT’s historical accounts show that FY26 revenue, gross profit, EBITDA and PAT were all higher than their FY22 levels, with revenue reaching Rs 999.1 crore and EBITDA reaching Rs 84.1 crore. The margins attached to those results were not linear: EBITDA margin declined to 8.4% from 10.7% in FY25, while PAT margin fell to 3.9% from 5.7%.
The next results will help resolve whether HIRECT can sustain the FY26 operating-cash-flow increase to Rs 85.8 crore while maintaining the September 2026 reduction in receivables to Rs 171.5 crore. They will also show how inventory of Rs 185.0 crore, current borrowings of Rs 175.7 crore and the FY26 investing outflow of Rs 90.3 crore affect cash generation and profitability ratios.