










HUDCO H1 profit rises 31.5% as spread narrows and leverage rises
Key highlights
- HUDCO's H1 FY27 net profit rose 31.5% year on year to Rs 1,762.15 crore.
- HUDCO's loan portfolio grew 28.75% to Rs 1,86,111 crore in H1 FY27.
- HUDCO's interest spread declined to 1.76% in H1 FY27 from 2.08% in H1 FY26.
- HUDCO's debt-equity ratio increased to 7.16 times from 6.98 times a year earlier.
powered by IRIS
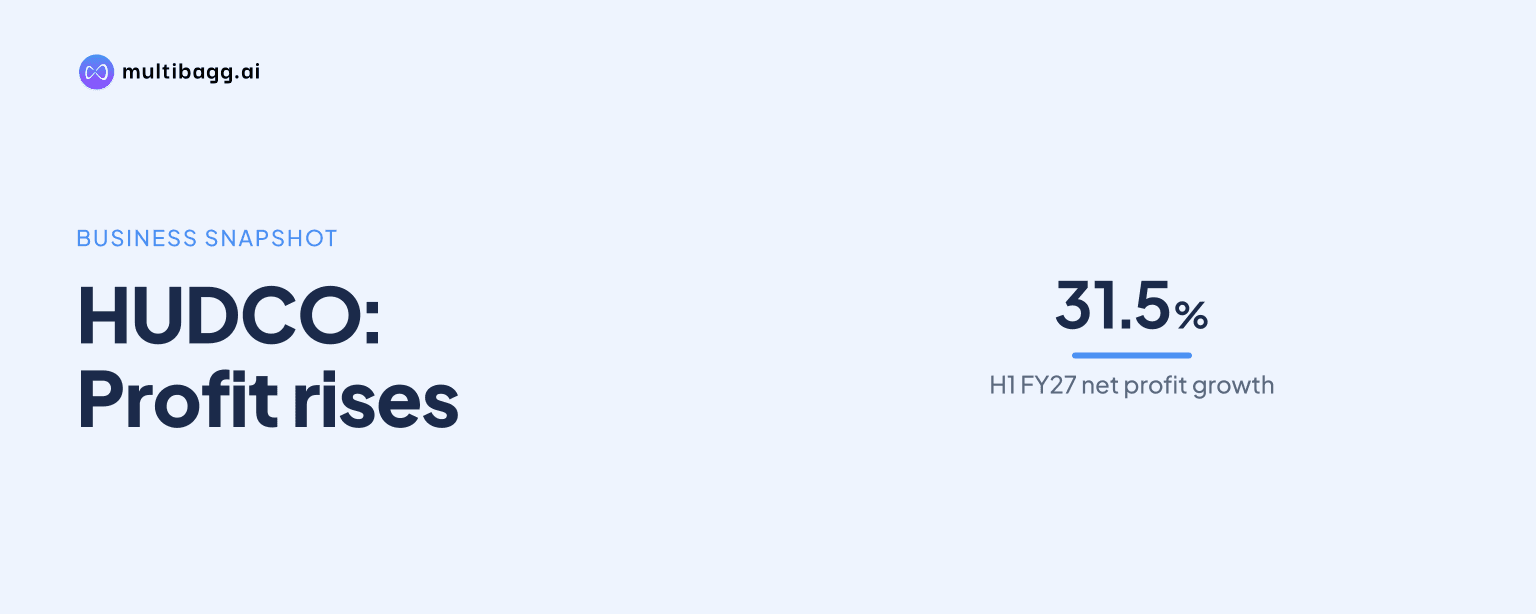
HUDCO reported reviewed standalone net profit of Rs 1,762.15 crore in H1 FY27, up 31.5% from Rs 1,340.06 crore in H1 FY26, as revenue from operations increased 26.01% to Rs 7,757.59 crore. Loan yield, interest spread and net interest margin declined, while the debt-equity ratio rose to 7.16 times.
Know Housing & Urban Development Corporation inside out
Results, valuation, peers and who's buying, in one view.
Why did HUDCO's H1 FY27 profit rise?
HUDCO's H1 FY27 profit rose as total income increased by more than total expenses in absolute rupee terms, despite higher finance cost. Revenue from operations grew by Rs 1,601.25 crore year on year to Rs 7,757.59 crore, while total income rose by Rs 1,592.39 crore to Rs 7,788.88 crore. Finance cost increased by Rs 1,294.98 crore to Rs 5,420.29 crore, while other cost declined to Rs 224.05 crore from Rs 379.18 crore.
Profit before tax was Rs 2,188.66 crore in H1 FY27, compared with Rs 1,811.94 crore in H1 FY26. Tax expense declined to Rs 426.51 crore from Rs 471.88 crore, and net profit increased by Rs 422.09 crore. In the second quarter, or Q2 FY27, net profit was Rs 911.04 crore against Rs 709.83 crore a year earlier, while revenue from operations rose to Rs 4,040.42 crore from Rs 3,219.03 crore.
How did HUDCO's loan book and lending activity change?
HUDCO's loan portfolio increased to Rs 1,86,111 crore in H1 FY27 from Rs 1,44,554 crore in H1 FY26, a rise of Rs 41,557 crore or 28.75%. The presentation describes the H1 FY27 loan book and sanctions as the highest ever. Sanctions grew 12.48% to Rs 1,04,592 crore from Rs 92,985 crore, while H1 FY27 disbursements were Rs 35,371.54 crore, also described as the highest H1 level.
The presentation also provides portfolio figures excluding a Rs 20,000 crore amount. On that basis, the H1 FY27 portfolio was Rs 1,66,111 crore, compared with Rs 1,24,554 crore in H1 FY26. The increase excluding that amount was therefore Rs 41,557 crore, the same absolute increase as on the reported portfolio basis.
Government and its agencies accounted for 99.25% of HUDCO's loan book, according to the presentation. Asset-quality measures improved alongside the portfolio expansion: gross non-performing assets, or gross NPAs, declined to 0.71% from 1.04% in FY26 and 1.67% in FY25. Net NPAs were 0.044%, compared with 0.053% in FY26, and the provision coverage ratio was 93.76%.
Got a follow-up? Ask IRIS
Why did HUDCO's lending margins narrow in H1 FY27?
HUDCO's lending margins narrowed because loan yield declined while cost of funds increased slightly on the reported portfolio basis. Yield on loans fell to 8.83% in H1 FY27 from 9.12% in H1 FY26, a decrease of 0.29 percentage points. Cost of funds increased to 7.07% from 7.04%, reducing interest spread, which HUDCO defines as loan yield minus cost of funds, to 1.76% from 2.08%.
Net interest margin declined to 2.64% from 2.98%. HUDCO calculates net interest margin as net interest income divided by average interest-earning assets. Excluding the Rs 20,000 crore amount identified in the presentation, loan yield fell to 8.82% from 9.17%, interest spread declined to 1.96% from 2.42%, and net interest margin decreased to 2.93% from 3.43%.
HUDCO's finance cost rose 31.39% in H1 FY27, faster than the 26.01% increase in revenue from operations. The presentation defines loan yield as interest income on loan assets, including interest received from settlements of NPA cases, divided by average loan assets. That calculation basis applies to the reported 8.83% H1 FY27 yield and the 9.12% H1 FY26 comparison.
What changed in HUDCO's leverage and shareholder returns?
HUDCO's debt-equity ratio rose to 7.16 times in H1 FY27 from 6.98 times in H1 FY26 and 6.43 times in FY26. Excluding government fully serviced bonds, the ratio was 6.29 times, compared with 5.87 times a year earlier and 5.52 times in FY26. HUDCO defines debt-equity as total debt divided by equity.
Net worth rose to Rs 22,959.05 crore from Rs 18,037.03 crore in H1 FY26, while average net worth increased to Rs 22,468.13 crore from Rs 18,003.41 crore. Book value per share increased to Rs 114.69 from Rs 90.10, based on a face value of Rs 10 per share. These increases occurred alongside H1 FY27 net profit of Rs 1,762.15 crore, although the debt-equity measure still rose.
Annualised return on assets was 1.95%, marginally above 1.93% in H1 FY26 but below 2.73% in FY26. Annualised return on equity was 15.35%, compared with 14.86% a year earlier and 18.36% in FY26. Interest coverage was 1.40 times, down from 1.42 times in H1 FY26 but above 1.36 times in FY26; HUDCO defines it as earnings before interest and tax divided by finance cost.
Conclusion
HUDCO's H1 FY27 results combined a 28.75% increase in the loan portfolio and 26.01% growth in revenue from operations with a 31.5% rise in net profit to Rs 1,762.15 crore. The same period showed a 0.29-percentage-point decline in loan yield, a 0.32-percentage-point reduction in interest spread and a 0.18-times increase in debt-equity from H1 FY26.
The next reported periods will show whether HUDCO sustains H1 FY27 sanctions of Rs 1,04,592 crore and disbursements of Rs 35,371.54 crore while managing loan yield and funding cost. The presentation also identifies zero net NPA as a target, following H1 FY27 net NPA of 0.044% and provision coverage of 93.76%.