










Ind-Swift own brands made 69.09% of Q2 FY27 export sales
Key highlights
- Ind-Swift own brands represented 69.09% of Q2 FY27 export sales, versus 30.91% for contract manufacturing.
- Europe contributed 29.50% of Q2 FY27 export sales through own brands and 22.83% through contract manufacturing.
- Ind-Swift reported more than 900 global product registrations, compared with more than 750 previously.
- Ind-Swift expects 333 registrations in 2026-27, including 144 in South East Asia and 109 in Africa plus FWA.
powered by IRIS
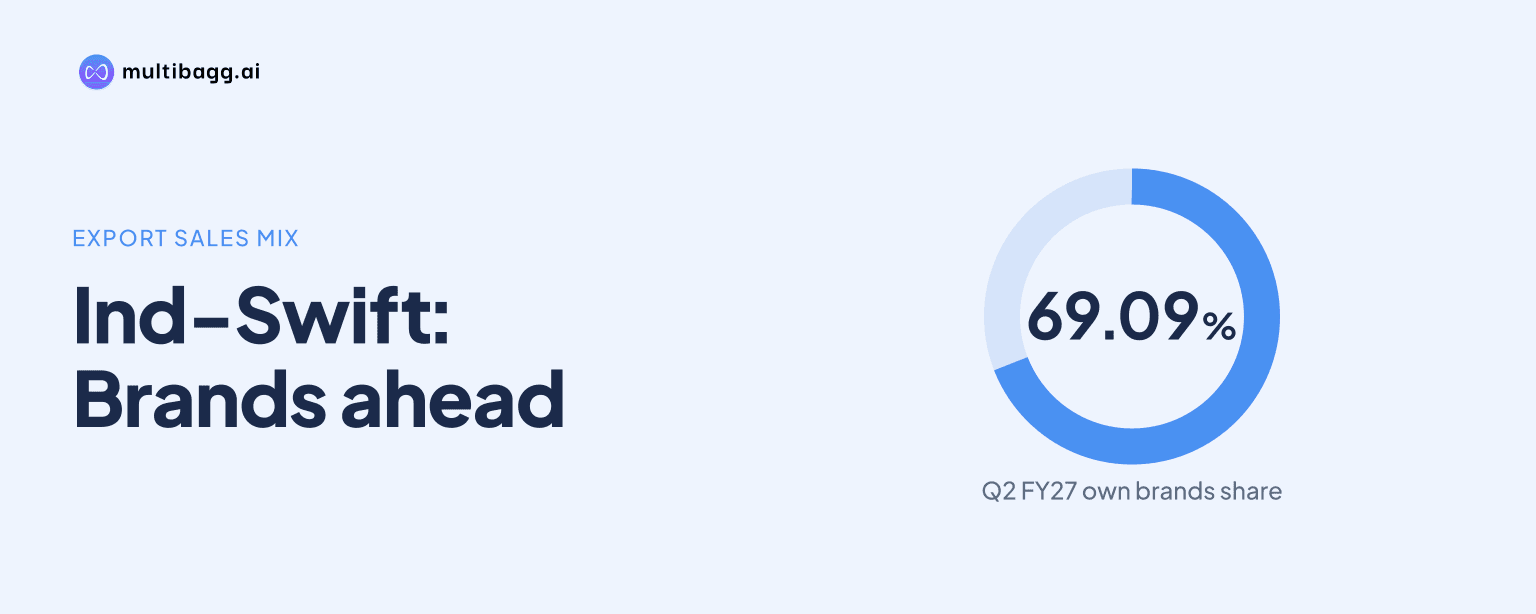
Ind-Swift Laboratories Limited said own brands accounted for 69.09% of Q2 FY27 export sales, against 30.91% from contract manufacturing. Europe was the largest contributor to both channels, while Ind-Swift reported more than 900 global product registrations, compared with more than 750 previously, and expects 333 further registrations in 2026-27.
Know Ind-Swift Laboratories inside out
Results, valuation, peers and who's buying, in one view.
How much of Ind-Swift’s Q2 FY27 exports came from own brands?
Ind-Swift’s own-brand business accounted for 69.09% of Q2 FY27 export sales, while contract manufacturing accounted for 30.91%. The 38.18-percentage-point difference means the export mix in the quarter was weighted towards products marketed under Ind-Swift brands rather than supplies manufactured for partners.
Europe was the largest territory in both export models. Own brands from Europe represented 29.50% of total export sales, compared with 22.83% for contract manufacturing. South East Asia was the next-largest own-brand territory at 10.45%, followed by the Middle East at 8.55%. Australia contributed 5.75% through contract manufacturing and 4.34% through own brands, while Canada’s 2.33% contribution was listed only under contract manufacturing.
The quarterly company sales chart uses a broader measure than export sales alone. Own brands represented 55.75% of total company sales in Q2 FY27, down from 56.72% in Q1 FY27, a decline of 0.97 percentage points. Export contract manufacturing increased to 26.99% from 26.64%, while domestic contract manufacturing, described as P2P in the presentation, rose to 5.00% from 3.61%.
Which export markets matter most to Ind-Swift’s own-brand model?
Europe is Ind-Swift’s largest own-brand export market at 29.50% of Q2 FY27 export sales and its largest contract-manufacturing market at 22.83%. The presentation’s market-distribution slide also assigns Europe 47% of distribution, ahead of South East Asia at 18% and Australia at 10%, placing Europe at the centre of the company’s export footprint.
Beyond Europe, the own-brand mix spans South East Asia, the Middle East, Africa and other territories. South East Asia represented 10.45% of export sales through own brands, the Middle East 8.55%, Africa 4.13%, and the Africa plus FWA category 4.20%. Mexico accounted for 2.83%, South Africa 1.81%, Latin America 1.78%, the Commonwealth of Independent States 0.61%, and the UAE 0.89%.
Ind-Swift describes its greenfield operations as direct marketing of branded products and says it has deployed more than 125 medical representatives in Uzbekistan, East Africa and Myanmar to capture higher margins. It also cites a wholly owned distribution setup with more than 100 medical representatives and 38 registered products in the Gulf Cooperation Council region. These arrangements are the stated route for local promotion of own-brand products in emerging markets.
Got a follow-up? Ask IRIS
What registration base supports Ind-Swift’s export expansion?
Ind-Swift reported more than 900 global product registrations in Q2 FY27, compared with more than 750 previously. Separately, its research and development function has filed more than 2,100 dossiers across more than 85 countries and owns more than 540 product registrations. A dossier is the regulatory product file used to seek marketing approval in a territory.
The product-registration footprint listed in the presentation is largest in Africa plus FWA at 209 registrations, followed by South East Asia with 177 and Europe with 170. Ind-Swift also lists 116 registrations in Commonwealth of Independent States markets plus nine in Russia, 86 in Latin America, 51 in the UAE, 47 in Gulf Cooperation Council markets, 34 in Australia, 19 in South Africa, 11 in Canada and six in New Zealand.
Ind-Swift expects 333 product registrations in 2026-27, with South East Asia accounting for 144 and Africa plus FWA for 109. Central Asia is expected to receive 21 registrations, Latin America 19, Europe 18, the Middle East 17, Australia four and Canada one. The planned registrations are therefore concentrated in South East Asia and the Africa plus FWA category, which together account for 253 of the 333 expected registrations.
What operational plans could support Ind-Swift’s export strategy?
Ind-Swift management says commercialised partnerships and own brands are expected to contribute incremental revenue of Rs 100 crore to Rs 130 crore in FY27. This is a management expectation rather than reported revenue. The company also said commercial validation of Clarithromycin Dry Suspension had been completed and that the product was expected to be commercialised shortly.
Warehouse development has commenced under Phase 1 of the capital-expenditure plan at the Derabassi export unit. Ind-Swift had acquired 18,000 square yards of land there for a dedicated warehouse. Derabassi is a 100% export-oriented unit with annual capacity of 9 billion tablets, 120 million capsules, 150 million sachets and 184 million sticks.
The upgrade of the Samba facility to European Union Good Manufacturing Practice and Pharmaceutical Inspection Co-operation Scheme standards is underway and progressing as planned, according to Ind-Swift. Management says the project is expected to support product filings in regulated markets. The company also lists 13 research and development molecule launches for 2028-29 and 2029-30, comprising 11 molecules in 2028-29 and two in 2029-30, without assigning revenue estimates to that pipeline.
Conclusion
Ind-Swift’s Q2 FY27 disclosures show that own brands led its export model, accounting for 69.09% of export sales compared with 30.91% for contract manufacturing. Europe contributed the largest share to both channels, while South East Asia, the Middle East, Africa and the Africa plus FWA category broadened the direct-brand footprint. The increase to more than 900 global product registrations from more than 750 provides the stated regulatory base for this expansion.
The next measures to watch are the expected 333 registrations in 2026-27, particularly 144 in South East Asia and 109 in Africa plus FWA. Management’s expectation of Rs 100 crore to Rs 130 crore of FY27 incremental revenue from commercialised partnerships and own brands, the planned commercialisation of Clarithromycin Dry Suspension, and progress on the Derabassi warehouse and Samba upgrade will show how the registration and distribution plans develop.