










Indag FY26 EBITDA recovers to Rs 22.4 crore despite lower sales
Key highlights
- Indag FY26 EBITDA rose to Rs 22.4 crore from Rs 16.5 crore in FY25.
- Indag FY26 revenue from operations declined to Rs 214.2 crore from Rs 224.8 crore in FY25.
- Indag generated Rs 20.2 crore of net operating cash flow in Mar-26, versus Rs 6.5 crore in Mar-25.
- Indag held Rs 146.6 crore in current and non-current investments at Mar-26.
powered by IRIS
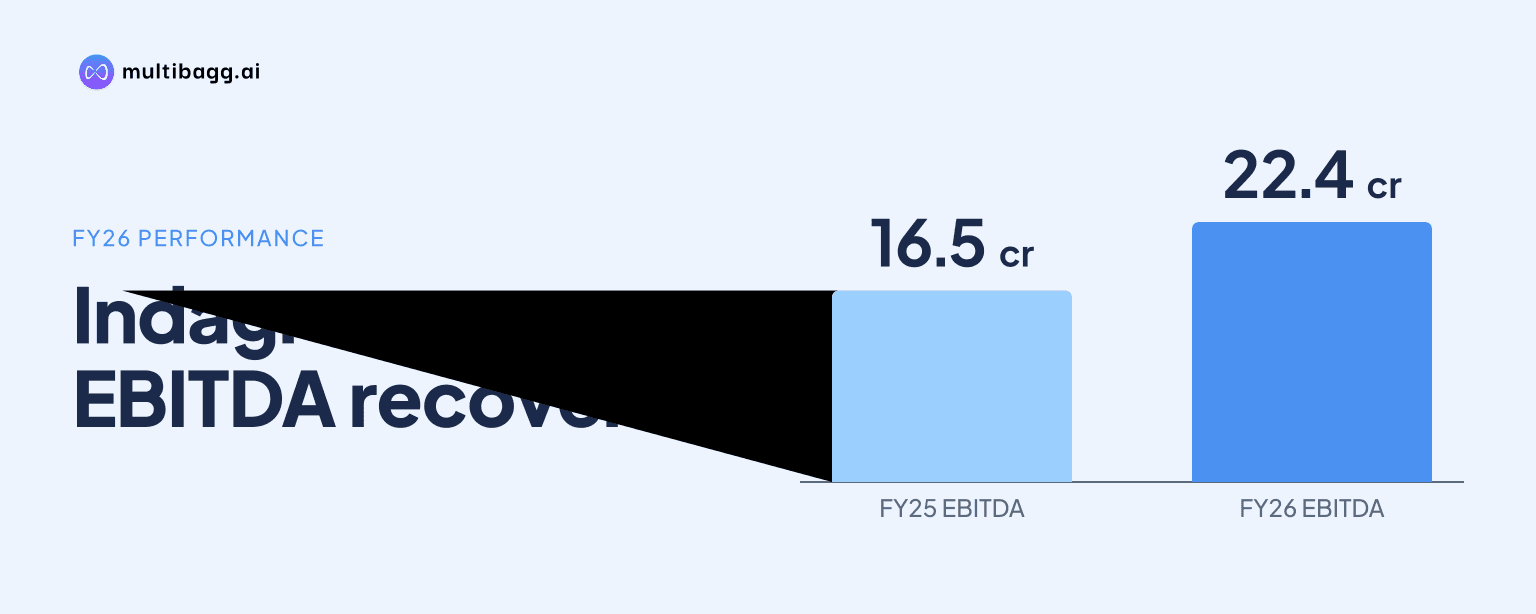
Indag Rubber Ltd reported FY26 standalone EBITDA of Rs 22.4 crore, up from Rs 16.5 crore in FY25, although revenue from operations fell to Rs 214.2 crore and remained below FY23 and FY24 levels. Indag also reported a 10.0% EBITDA margin and Rs 20.2 crore of net cash from operating activities in Mar-26.
Know Indag Rubber inside out
Results, valuation, peers and who's buying, in one view.
How did Indag’s FY26 profitability recover?
Indag’s FY26 profitability recovered as EBITDA increased by Rs 5.9 crore year on year to Rs 22.4 crore and EBITDA margin rose to 10.0% from 7.0% in FY25. Profit after tax increased to Rs 12.4 crore from Rs 8.4 crore, while earnings per share rose to Rs 4.72 from Rs 3.21.
The reported cost base was lower than in FY25. Raw-material cost declined to Rs 147.2 crore from Rs 161.6 crore, employee expenses fell to Rs 25.1 crore from Rs 26.6 crore, and other expenses reduced to Rs 30.1 crore from Rs 32.2 crore. Gross profit increased to Rs 77.6 crore from Rs 75.3 crore, lifting gross profit margin to 34.5% from 31.8%.
Why was Indag’s FY26 revenue below earlier years?
Indag’s FY26 revenue from operations was Rs 214.2 crore, down Rs 10.6 crore from Rs 224.8 crore in FY25 and below Rs 251.2 crore in FY24 and Rs 243.9 crore in FY23. This was the second consecutive annual decline after revenue from operations fell from the FY24 level to FY25.
Total revenue including other income was Rs 224.8 crore in FY26, compared with Rs 236.9 crore in FY25, Rs 261.2 crore in FY24 and Rs 252.2 crore in FY23. Other income declined to Rs 10.6 crore from Rs 12.1 crore in FY25, but remained above Rs 10.0 crore in FY24 and Rs 8.4 crore in FY23.
The comparison indicates that the FY26 profit recovery occurred without revenue returning to its FY24 peak. FY26 EBITDA of Rs 22.4 crore was Rs 5.3 crore below FY24 EBITDA of Rs 27.7 crore, but Rs 0.4 crore above FY23 EBITDA of Rs 22.0 crore. Depreciation was Rs 5.6 crore in FY26 against Rs 5.5 crore in FY25, resulting in earnings before interest and tax of Rs 16.8 crore, compared with Rs 11.0 crore.
What did Indag’s FY26 operating cash flow show?
Indag generated Rs 20.2 crore of net cash from operating activities in Mar-26, compared with Rs 6.5 crore in Mar-25 and Rs 19.9 crore in Mar-24. Cash generated from operations before direct taxes was Rs 23.7 crore in Mar-26, versus Rs 9.1 crore in the preceding year.
The cash-flow statement recorded a positive Rs 6.6 crore change in working capital in Mar-26, compared with a negative Rs 0.5 crore change in Mar-25. Operating profit before working-capital changes increased to Rs 17.1 crore from Rs 9.5 crore, while direct taxes paid rose to Rs 3.6 crore from Rs 2.5 crore.
Investing activities used Rs 10.5 crore in Mar-26 after providing Rs 0.7 crore in Mar-25, while financing activities used Rs 7.3 crore after generating Rs 9.0 crore in the prior year. Cash and cash equivalents at the end of Mar-26 were Rs 3.6 crore, compared with Rs 1.3 crore at the end of Mar-25.
Got a follow-up? Ask IRIS
How was Indag’s balance sheet positioned at March 2026?
Indag reported total equity of Rs 235.6 crore at Mar-26, up from Rs 230.1 crore at Mar-25, within total equity and liabilities of Rs 278.5 crore. Share capital remained Rs 5.3 crore, while other equity increased to Rs 230.4 crore from Rs 224.8 crore.
Total non-current liabilities declined to Rs 8.3 crore from Rs 10.1 crore, including lease liabilities of Rs 3.8 crore against Rs 5.0 crore. Current liabilities rose to Rs 34.6 crore from Rs 29.2 crore, as trade payables increased to Rs 25.9 crore from Rs 21.3 crore.
Indag held Rs 94.0 crore of non-current investments and Rs 52.6 crore of current investments at Mar-26, totalling Rs 146.6 crore. The comparable Mar-25 total was Rs 134.8 crore, comprising Rs 104.0 crore of non-current investments and Rs 30.8 crore of current investments, showing a shift towards current investments.
Which FY26 working-capital balances changed most?
Indag’s inventories increased to Rs 47.2 crore at Mar-26 from Rs 45.2 crore a year earlier, while trade receivables decreased to Rs 22.2 crore from Rs 25.1 crore. Other current assets rose to Rs 7.6 crore from Rs 6.9 crore, and total current assets increased to Rs 136.3 crore from Rs 112.6 crore.
Property, plant and equipment declined to Rs 25.0 crore from Rs 26.1 crore, while investment property reduced to Rs 17.7 crore from Rs 18.8 crore. Capital work-in-progress was Rs 0.1 crore at Mar-26, compared with Rs 0.4 crore at Mar-25, alongside the Rs 10.5 crore net investing cash outflow reported for Mar-26.
Conclusion
Indag’s FY26 figures show higher profitability and operating cash generation despite lower revenue from operations. EBITDA rose to Rs 22.4 crore and net operating cash flow reached Rs 20.2 crore, while gross profit margin increased to 34.5%; however, revenue was Rs 37.0 crore below FY24 and EBITDA was Rs 5.3 crore below that year’s level.
The next disclosed event is Indag’s FY27 interim dividend of Rs 0.90 per equity share of Rs 2 face value, with a record date of 16 November 2026. The presentation also states that Millenium Manufacturing Systems received and fully executed its first commercial serial order in FY26 for Power Conversion Systems used in Battery Energy Storage Systems, which is a disclosed development to monitor with future revenue and margin trends.