










Indag Rubber Limited Q2 revenue rises 27%, EBITDA margin falls
Key highlights
- Indag's Q2 FY27 total revenue rose 27% year on year to Rs 69.84 crore.
- Q2 FY27 EBITDA fell 10% to Rs 5.6 crore and EBITDA margin declined 324 basis points to 8.0%.
- Q2 FY27 raw-material cost increased to Rs 49.6 crore from Rs 35.2 crore in Q2 FY26.
- H1 FY27 profit after tax increased 53% year on year to Rs 8.4 crore.
powered by IRIS
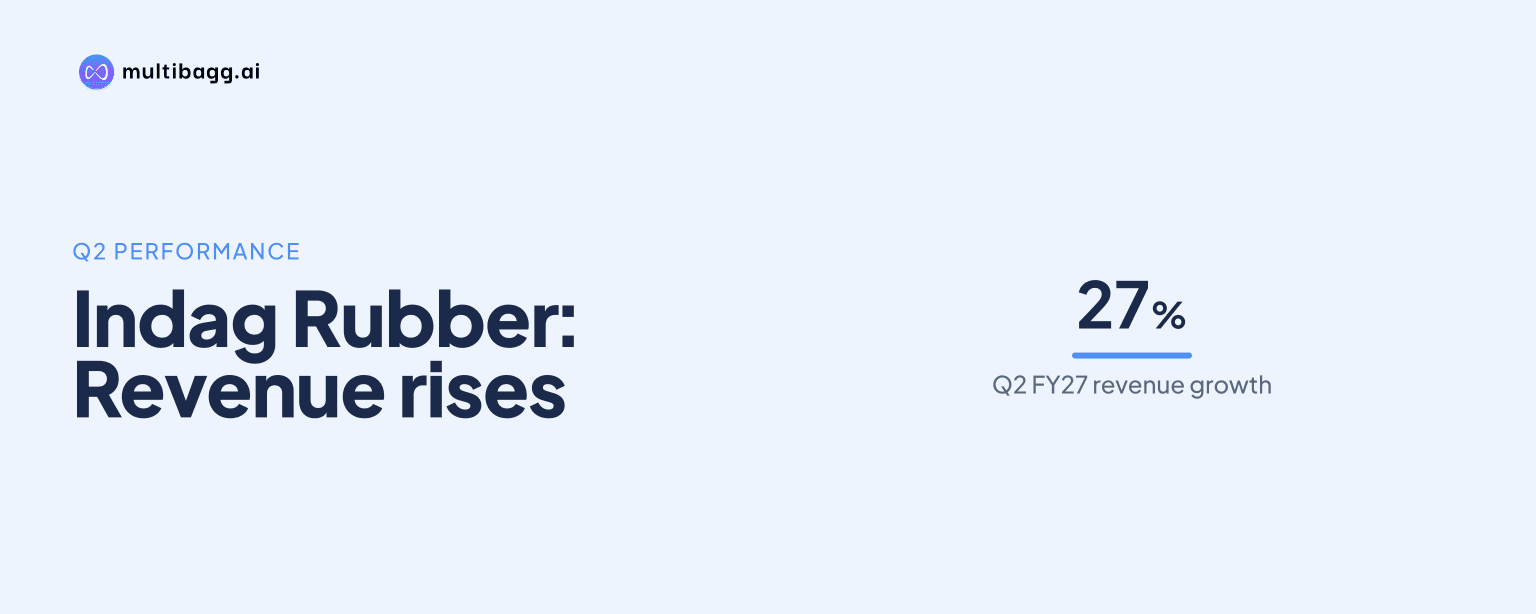
Indag Rubber Limited lifted Q2 FY27 total revenue 27% year on year to Rs 69.84 crore, yet EBITDA margin fell 324 basis points to 8.0% as total raw-material cost rose to Rs 49.6 crore from Rs 35.2 crore, limiting the profit effect of higher sales volumes.
Know Indag Rubber inside out
Results, valuation, peers and who's buying, in one view.
Why did Indag's Q2 FY27 margin fall despite revenue growth?
Indag's Q2 FY27 margin fell because raw-material costs increased faster than gross profit, limiting the earnings benefit from higher sales volumes. Revenue from operations increased 29% year on year to Rs 67.5 crore, while total revenue, including Rs 2.3 crore of other income, rose to Rs 69.8 crore from Rs 55.0 crore. Total raw-material cost rose by Rs 14.4 crore to Rs 49.6 crore.
Gross profit increased 2% to Rs 20.2 crore in Q2 FY27 from Rs 19.8 crore a year earlier, despite the 27% increase in total revenue. Gross profit as a share of total revenue fell to 29.0% from 36.0%, a decline of 699 basis points, where 100 basis points equal one percentage point. Management said raw-material costs remained high after the 2026 West Asia escalation and weighed on quarterly margins.
How did Indag's Q2 FY27 profit compare with earlier periods?
Indag's Q2 FY27 profit after tax fell 9% year on year to Rs 3.3 crore, while EBITDA declined 10% to Rs 5.6 crore despite the higher revenue base. EBITDA margin was 8.0%, down from 11.3% in Q2 FY26, and profit-after-tax margin declined to 4.7% from 6.6%. Earnings before interest and tax fell 9% to Rs 4.3 crore, while profit before tax was Rs 4.1 crore against Rs 4.6 crore a year earlier.
The Q2 FY27 result also trailed Q1 FY27 on reported profitability. Q1 FY27 EBITDA was Rs 8.2 crore at a 13.6% margin, compared with Rs 5.6 crore and an 8.0% margin in Q2 FY27. Profit after tax was Rs 5.1 crore at an 8.4% margin in Q1 FY27, versus Rs 3.3 crore and 4.7% in Q2 FY27.
Employee expenses were unchanged year on year at Rs 6.2 crore in Q2 FY27, while other expenses increased to Rs 8.4 crore from Rs 7.4 crore. Depreciation declined to Rs 1.3 crore from Rs 1.5 crore, but that reduction did not offset the decline in EBITDA. Finance cost was Rs 0.1 crore in both Q2 FY27 and Q2 FY26.
What does Indag's H1 FY27 performance show?
Indag's H1 FY27 results remained above H1 FY26 levels despite the Q2 margin decline, with total revenue up 27% to Rs 130.3 crore and EBITDA up 36% to Rs 13.8 crore. Revenue from operations rose 28% to Rs 125.0 crore, while other income declined to Rs 5.2 crore from Rs 5.6 crore. The first-half EBITDA margin increased 74 basis points to 10.6% from 9.9%.
The half-year comparison shows a different outcome from the standalone quarter. H1 FY27 raw-material cost rose to Rs 87.7 crore from Rs 66.6 crore, but gross profit increased 17% to Rs 42.6 crore from Rs 36.3 crore. Gross margin still declined to 32.7% from 35.3%, a contraction of 258 basis points.
Profit after tax increased 53% to Rs 8.4 crore in H1 FY27 from Rs 5.5 crore in H1 FY26, while the profit-after-tax margin rose 111 basis points to 6.4%. Earnings before interest and tax increased 54% to Rs 11.2 crore, and depreciation fell to Rs 2.6 crore from Rs 2.9 crore. These first-half gains contrast with the 9% year-on-year decline in Q2 profit after tax.
Got a follow-up? Ask IRIS
How is Indag responding to raw-material pressure?
Indag said it is addressing Q2 FY27 cost pressure through calibrated price pass-through, raw-material monitoring, and supplier and geography diversification. Management disclosed these actions after Q2 FY27 raw-material cost reached Rs 49.6 crore and gross margin declined 699 basis points year on year. The presentation does not provide a timetable, price-increase amount or specific margin target for the measures.
Management also said Indag continued structured technical training and on-ground audits with franchisee partners during Q2 FY27, alongside a CEO's Club meet for top-performing dealers. The company said it serves performance-seeking customers through its Indag-branded product portfolio. It did not disclose Q2 sales volumes, dealer additions or a revenue contribution from those activities.
What is Indag's retreading business footprint and capacity?
Indag reported a nationwide network of more than 15 depots, more than 300 dealers, more than 50 sales and technical team members, and more than 3,000 retreaders. Its pre-cured tread rubber capacity is 20,000 metric tonnes a year, supporting applications across medium and heavy commercial vehicles, light commercial vehicles, passenger vehicles and off-road vehicles.
The company also reported universal spray cement capacity of 2,200 kilolitres a year across three variants and un-vulcanized rubber strip gum capacity of 5,000 metric tonnes a year. Management said a retreaded tyre can save up to about 70% of the cost of a new tyre and can reduce cost per kilometre to nearly one-third, while saving 57 litres of oil, 44 kilograms of rubber and about 136 kilograms of carbon-dioxide emissions versus a new tyre.
What did Indag disclose about Millenium Manufacturing Systems?
Indag said its subsidiary, Millenium Manufacturing Systems, completed its first commercial serial order in the power-electronics segment. All systems in the order were invoiced and despatched to a customer in Europe, according to management's Q2 FY27 statement.
Millenium Manufacturing Systems is described by management as an electronics manufacturing services provider serving the global green-energy transition. The presentation does not disclose the order value, delivery date, revenue booked from the order or the subsidiary's separate financial contribution to Indag's Q2 FY27 or H1 FY27 results.
Conclusion
Indag's Q2 FY27 figures show that higher sales volumes lifted revenue but did not translate proportionately into quarterly profit. Raw-material cost rose Rs 14.4 crore year on year, while gross profit increased only Rs 0.4 crore, resulting in a 699-basis-point decline in gross margin and a 324-basis-point decline in EBITDA margin. H1 FY27 nevertheless remained ahead of H1 FY26 on revenue, EBITDA and profit after tax.
The next results will show whether management's calibrated price pass-through, raw-material monitoring, and supplier and geography diversification limit the effect of elevated input costs. Investors can also watch for further disclosures on Millenium Manufacturing Systems after its first commercial serial order was invoiced and despatched to Europe.