










Indigo Paints Q2 EBITDA margin falls to 8.9% on higher costs
Key highlights
- Indigo Paints’ standalone Q2 FY27 revenue rose 14.1% to Rs 340.5 crore.
- Q2 FY27 EBITDA fell 33.8% to Rs 30.3 crore, reducing the EBITDA margin to 8.9% from 15.3%.
- Standalone gross margin declined to 38.5% in Q2 FY27 from 45.1% a year earlier.
- Q2 FY27 PAT dropped 45.9% to Rs 13.8 crore, while PAT margin fell to 4.0% from 8.5%.
powered by IRIS
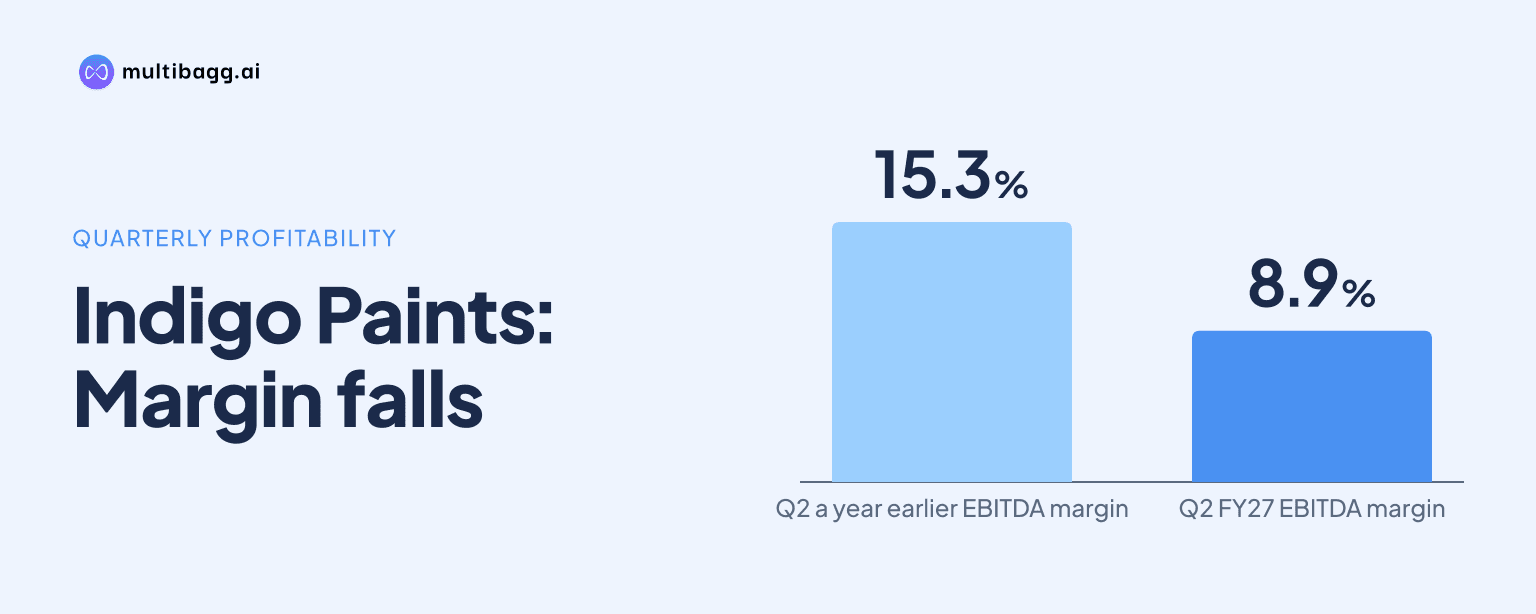
Indigo Paints Ltd reported 14.1% standalone revenue growth in Q2 FY27, but earnings before interest, tax, depreciation and amortisation (EBITDA) margin fell to 8.9% from 15.3% a year earlier. EBITDA declined 33.8% to Rs 30.3 crore as an unfavourable product mix, higher discounts, high-cost raw-material inventory and increased advertising spending affected profitability.
Know Indigo Paints inside out
Results, valuation, peers and who's buying, in one view.
Why did Indigo Paints’ Q2 FY27 EBITDA margin fall?
Indigo Paints’ Q2 FY27 EBITDA margin fell because gross-margin erosion linked to product mix and inventory costs was compounded by higher advertising and promotion spending. Standalone EBITDA fell to Rs 30.3 crore from Rs 45.8 crore in Q2 FY26, although revenue from operations rose to Rs 340.5 crore from Rs 298.5 crore.
The EBITDA margin reduced by 6.4 percentage points, to 8.9% from 15.3%. Profit after tax (PAT) fell 45.9% to Rs 13.8 crore, and PAT margin declined to 4.0% from 8.5%, extending the quarterly pressure beyond operating profit.
How did product mix and discounts affect Indigo Paints’ revenue?
Indigo Paints said an unfavourable product mix resulted in higher discounts, limiting Q2 FY27 net revenue growth to 14.1% despite gross revenue growth of 18.8%. The 4.7-percentage-point gap between those growth rates shows the extent to which discounting affected reported net revenue growth during the quarter.
The mix issue also coincided with standalone gross margin falling to 38.5% in Q2 FY27 from 45.1% in Q2 FY26. Indigo Paints identified gross-margin erosion as the main factor weighing on EBITDA, before the additional effect of higher advertising and promotion investment.
The company said its EBITDA margin has historically peaked in Q4 as product mix improves. Its standalone margin was 17.7% in Q1 FY27 before falling to 8.9% in Q2 FY27, while the previous year’s margin rose from 14.8% in Q1 FY26 to 15.3% in Q2 FY26 and reached 23.0% in Q4 FY26.
What was the effect of high-cost raw-material inventory?
Indigo Paints identified high-cost raw-material inventory carried over from the previous quarter as the second component of a double impact on Q2 FY27 gross margin. Alongside the unfavourable product mix, the inventory cost headwind accompanied the 6.6-percentage-point gross-margin decline to 38.5%.
The cost pressure occurred despite higher sales. Standalone revenue increased by Rs 42.0 crore year on year in Q2 FY27, whereas EBITDA decreased by Rs 15.5 crore, illustrating the divergence between revenue growth and operating profit during the quarter.
Indigo Paints did not quantify separately the rupee effect of high-cost inventory or product mix. For the first half (H1) of FY27, gross margin was 41.9%, compared with 45.6% in H1 FY26, a 3.7-percentage-point decline that was narrower than the Q2 movement.
Got a follow-up? Ask IRIS
How much did Indigo Paints spend on advertising and promotion?
Indigo Paints spent Rs 18.3 crore on advertising and promotion (A&P) in Q2 FY27, compared with Rs 15.7 crore in Q2 FY26. A&P represented 5.4% of revenue from operations, up from 5.3%, and the company attributed the increase to media and below-the-line (BTL) engagement activities.
The increase in A&P intensity came while gross margin declined to 38.5% from 45.1%. Indigo Paints said higher A&P investment compounded the effect of gross-margin erosion on the quarterly EBITDA margin of 8.9%.
For H1 FY27, A&P was 4.8% of revenue from operations, down from 6.0% in H1 FY26. The lower six-month ratio contrasts with the year-on-year increase in the Q2 ratio to 5.4%.
Did Indigo Paints remain profitable in H1 FY27?
Indigo Paints remained profitable and increased first-half earnings in rupee terms, although margins declined from H1 FY26. Standalone revenue from operations rose 16.4% to Rs 690.5 crore, EBITDA increased 3.2% to Rs 92.3 crore, and PAT rose 8.3% to Rs 56.2 crore.
H1 FY27 EBITDA margin was 13.4%, compared with 15.1% in H1 FY26, while PAT margin declined to 8.0% from 8.6%. Those first-half movements were less pronounced than the Q2 FY27 margins of 8.9% for EBITDA and 4.0% for PAT.
Other income was affected by an adverse bond-yield movement in Q2 FY27, according to Indigo Paints. On a consolidated basis, Q2 FY27 EBITDA was Rs 31.0 crore versus Rs 46.5 crore a year earlier, while PAT was Rs 13.4 crore versus Rs 25.2 crore.
Conclusion
Indigo Paints delivered double-digit standalone revenue growth in Q2 FY27, but higher discounts associated with product mix, high-cost raw-material inventory and higher A&P expenditure reduced profitability. Revenue increased 14.1%, while EBITDA declined 33.8% and PAT fell 45.9%, with gross margin down to 38.5% from 45.1%.
The next result to watch is whether product mix improves, as Indigo Paints says EBITDA margin has historically peaked in Q4 when mix improves. The disclosed unresolved factors are the effect of higher discounts and inventory carried over from the prior quarter, while H1 FY27 EBITDA margin stood at 13.4%.