




Earnings Call/Transcript
Indigo Paints Q2 FY27 Earnings Call Transcript
Indigo Paints filed the transcript of its November 2, 2026 earnings call covering Q2 and H1 FY27 results.





IRIS
Multibagg AI is an AI powered stock research and analysis platform. We provide data, information, content, and analytics for publicly traded Indian companies listed on NSE and BSE. AI can make mistakes, check important information.
Prices might be delayed by a few minutes.
Join our Exclusive Community


Join our Exclusive Community
Made with 💙 in India. © Finsky Technologies Pvt Ltd. 2026


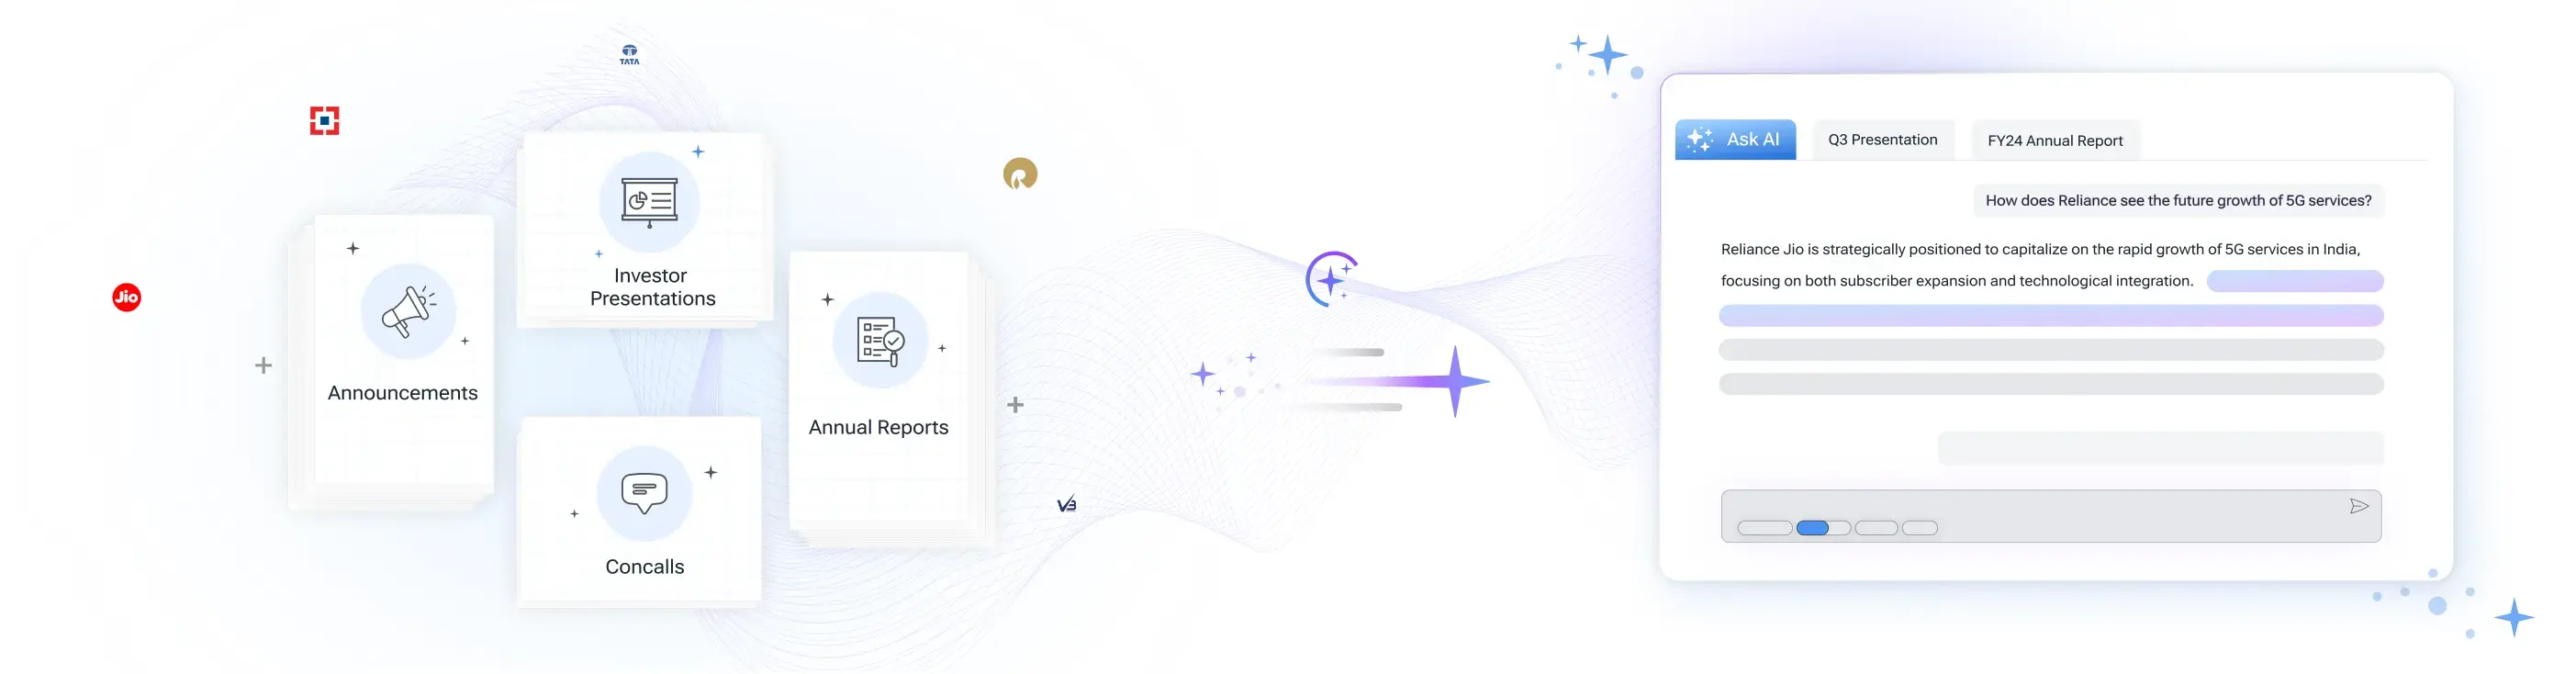
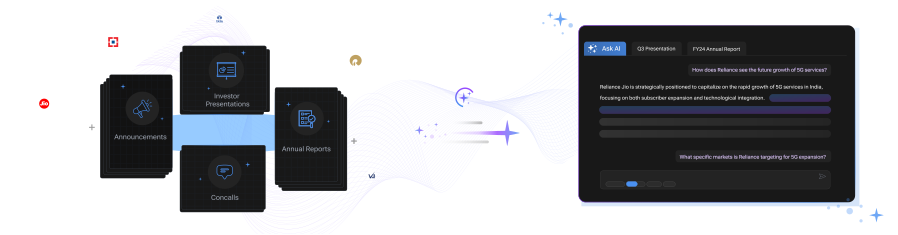
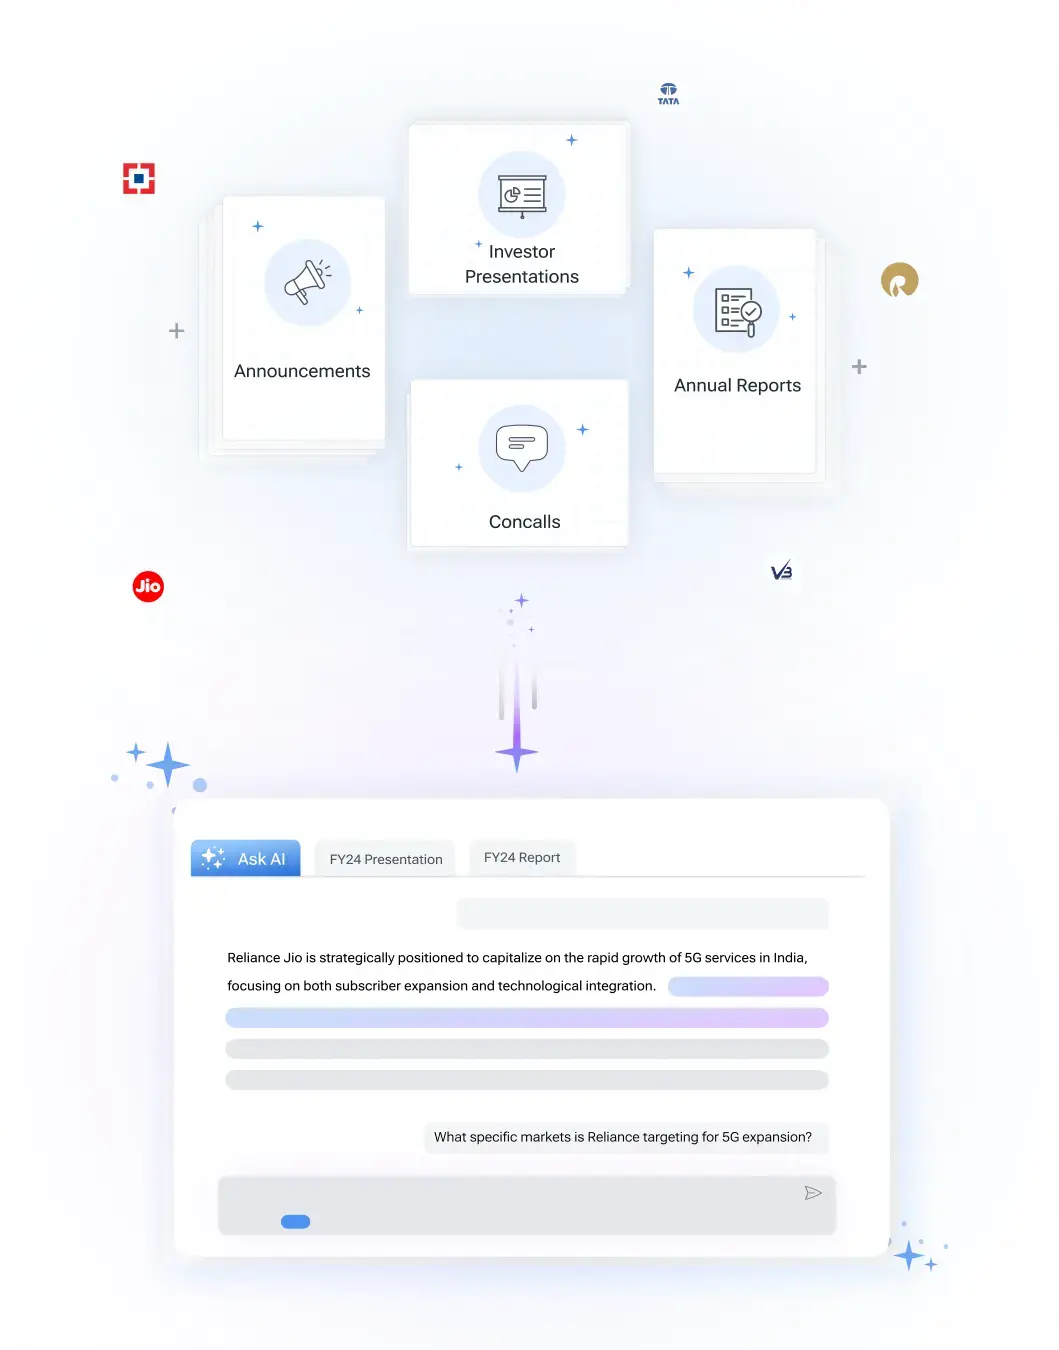
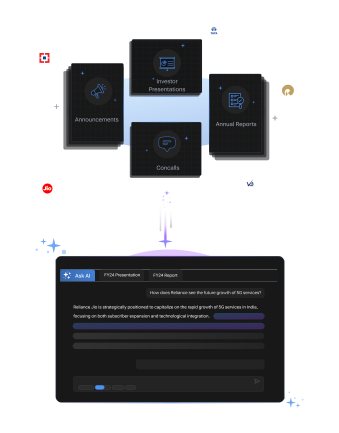
Get instant AI-powered insights about company performance, financials, and strategy. Ask questions about trends, competition, and developments while receiving responses backed by official documents and market data, with clear attribution to source documents.

 Discovery themes featuring this stock
Bearish
3
Neutral
7
Bullish
4
Bearish
29
Neutral
7
Bullish
10
Bearish
26
Neutral
0
Bullish
6
Bearish
26
Neutral
0
Bullish
6
Bearish
26
Neutral
0
Bullish
6
Bearish
26
Neutral
0
Bullish
6





Indigo Paints manufactures and sells decorative paints, putty, waterproofing products and related coatings through six plants, nearly 19,730 active dealers, more than 12,700 tinting machines and 56 depots across 28 states. Its portfolio spans emulsions, enamels, wood coatings, distempers, primers, putties and cement paints, supported by differentiated products and a painter-led distribution model.
The headline Q2 performance masks a sharp profitability disruption: standalone revenue increased 14.1% to INR 340.5 crore, but EBITDA margin fell to 8.9% from 15.3%. Management attributed most of the decline to high-cost raw-material inventory purchased during the March-April price shock, with September margins reportedly returning close to normal.
Indigo Paints’ first-half performance provides a more balanced view than Q2 alone. Standalone H1 revenue rose 16.4% to INR 690.5 crore, while EBITDA increased 3.2% and PAT increased 8.3% despite gross-margin compression. The company expects stronger second-half profitability because Q3 and Q4 typically benefit from premium-product mix and higher seasonal demand.
The company is pursuing growth more aggressively without relying primarily on discounts. Management is increasing engagement with painters, contractors, influencers and sales teams, while expanding depots and premium product availability. October reportedly delivered record sales, the strongest year-on-year monthly growth in three or four years, although management remains cautious about geopolitical uncertainty.
The Jodhpur water-based plant is moving from trial production toward commercial operations, adding 90,000 kilolitres of annual capacity. With South India capacity still underutilized and the new facility expected to improve North, East and Central India supply, management believes capacity will not constrain growth and anticipates only minor capex for the next two to three years.
Consumer Durables
Paints
4,376 Cr
Moderate Risk
28.9
43.4
1.6
3.7
1,345.00
702.10
Sales CAGR
Profit CAGR
ROE
ROCE
Discovery themes featuring this stock
| Symbol | Watchlist | Price | Market Cap | P/E | P/B | Div Yield (%) | ROE (%) | ROCE (%) | ROA (%) |
200.50 | 16,250 Cr | 27.11 | 2.36 | 1.87 | 8.88 | 11.89 | 6.51 | ||
280.00 | 12,710 Cr | 36.20 | 5.47 | 7.37 | 15.11 | 20.39 | 9.07 | ||
917.60 | 4,376 Cr | 28.91 | 3.70 | 0.54 | 12.60 | 16.08 | 9.18 | ||
406.30 | 2,310 Cr | 33.35 | 4.62 | 0.49 | 13.86 | 17.78 | 10.95 | ||
80.52 | 680 Cr | -7.74 | 7.47 | 0.00 | -43.98 | -18.07 | -13.94 | ||
4.14 | 141 Cr | -18.53 | 0.77 | 0.00 | -4.41 | -1.97 | -2.53 | ||
26.00 | 40 Cr | 12.31 | 1.21 | 0.00 | 14.46 | 15.28 | 9.53 | ||
| Median: 7 Co. | — | 200.50 | 2,310 Cr | 27.11 | 3.70 | 0.49 | 12.60 | 15.28 | 9.07 |
Earnings Call/Transcript
Indigo Paints filed the transcript of its November 2, 2026 earnings call covering Q2 and H1 FY27 results.
Regulatory/Compliance Filing
Indigo Paints received an independently assigned ESG score of 64 from SES ESG Research, based on publicly available data.
View Standalone
View Standalone
View Standalone
View Standalone
View Standalone
View Standalone
View Standalone
View Standalone
Indigo Paints Ltd (INDIGOPNTS) is currently trading at 917.60 per share. Stock prices fluctuate during market hours on NSE and BSE based on demand, company updates, and overall market conditions. Refer to the live price chart above for the most recent price movement.
Indigo Paints manufactures and sells decorative paints, putty, waterproofing products and related coatings through six plants, nearly 19,730 active dealers, more than 12,700 tinting machines and 56 depots across 28 states. Its portfolio spans emulsions, enamels, wood coatings, distempers, primers, putties and cement paints, supported by differentiated products and a painter-led distribution model. The headline Q2 performance masks a sharp profitability disruption: standalone revenue increased 14.1% to INR 340.5 crore, but EBITDA margin fell to 8.9% from 15.3%. Management attributed most of the decline to high-cost raw-material inventory purchased during the March-April price shock, with September margins reportedly returning close to normal. Indigo Paints’ first-half performance provides a more balanced view than Q2 alone. Standalone H1 revenue rose 16.4% to INR 690.5 crore, while EBITDA increased 3.2% and PAT increased 8.3% despite gross-margin compression. The company expects stronger second-half profitability because Q3 and Q4 typically benefit from premium-product mix and higher seasonal demand. The company is pursuing growth more aggressively without relying primarily on discounts. Management is increasing engagement with painters, contractors, influencers and sales teams, while expanding depots and premium product availability. October reportedly delivered record sales, the strongest year-on-year monthly growth in three or four years, although management remains cautious about geopolitical uncertainty. The Jodhpur water-based plant is moving from trial production toward commercial operations, adding 90,000 kilolitres of annual capacity. With South India capacity still underutilized and the new facility expected to improve North, East and Central India supply, management believes capacity will not constrain growth and anticipates only minor capex for the next two to three years.
Over the past 52 weeks, Indigo Paints Ltd has traded between a low of ₹702.10 and a high of ₹1,345.00. The 52-week high and low indicate the stock’s price range over the last year and help investors understand its volatility and recent trading levels.
Indigo Paints Ltd has a market capitalization of approximately 4,376.37. Market capitalization represents the total value of a company’s outstanding shares and helps investors understand its size, stability, and relative risk compared to other listed companies.
Indigo Paints Ltd’s investment profile depends on its business fundamentals, valuation, and long-term outlook. The stock currently trades at a PE ratio of 28.91 and operates in the its sector sector. Investors typically assess financial performance, growth prospects, and individual risk tolerance before making investment decisions.
Based on its market capitalization of 4,376.37 Cr, Indigo Paints Ltd is classified as a Small Cap stock. Large-cap stocks are generally more stable, while mid-cap and small-cap stocks tend to offer higher growth potential along with higher price volatility.
Indigo Paints Ltd operates in the its sector sector. Sector classification matters because companies in the same sector are often affected by similar economic conditions, regulatory changes, and competitive dynamics, which can influence overall stock performance.
The Price-to-Earnings (PE) ratio of Indigo Paints Ltd is 28.91. The PE ratio compares a company’s share price to its earnings and is commonly used to assess valuation. Comparing the PE ratio with sector peers and historical levels provides better context.
Indigo Paints said high-cost raw materials bought in March and April 2026 were consumed and recorded in Q2 FY27. This reduced its EBITDA margin to 8.9% from 15.3% in Q2 FY26. A lower-margin sales mix and higher advertising and promotion spending also had an effect.
Indigo Paints said the water-based Jodhpur plant started trial production in late September 2026. Management expected trial completion around the end of November and full production from December, although it allowed for a 10 to 15-day timing variation.
Indigo Paints started trial production at the new Jodhpur water-based plant in September 2026. Management said it hopes the facility will be fully operational by the end of November 2026.
Indigo Paints reported consolidated revenue of ₹358.7 crore in Q2 FY27. The figure includes subsidiary Apple Chemie India Limited and was 15% higher than the corresponding quarter a year earlier.