










Indo-MIM Limited debt falls, but cash cycle reaches 417 days
Key highlights
- Indo-MIM’s debt-to-equity ratio fell to 0.27x in H1 FY27 from 0.50x in H1 FY26.
- Total borrowings were Rs 941 crore at 30 September 2026, compared with Rs 1,255 crore in the previous comparison.
- Indo-MIM’s cash conversion cycle increased to 417 days from 324 days as inventory days rose to 441.
- Operating cash flow was Rs 444.3 crore in H1 FY27, while operating-cash-flow-to-EBITDA conversion fell to 55.3% from 97.4%.
powered by IRIS
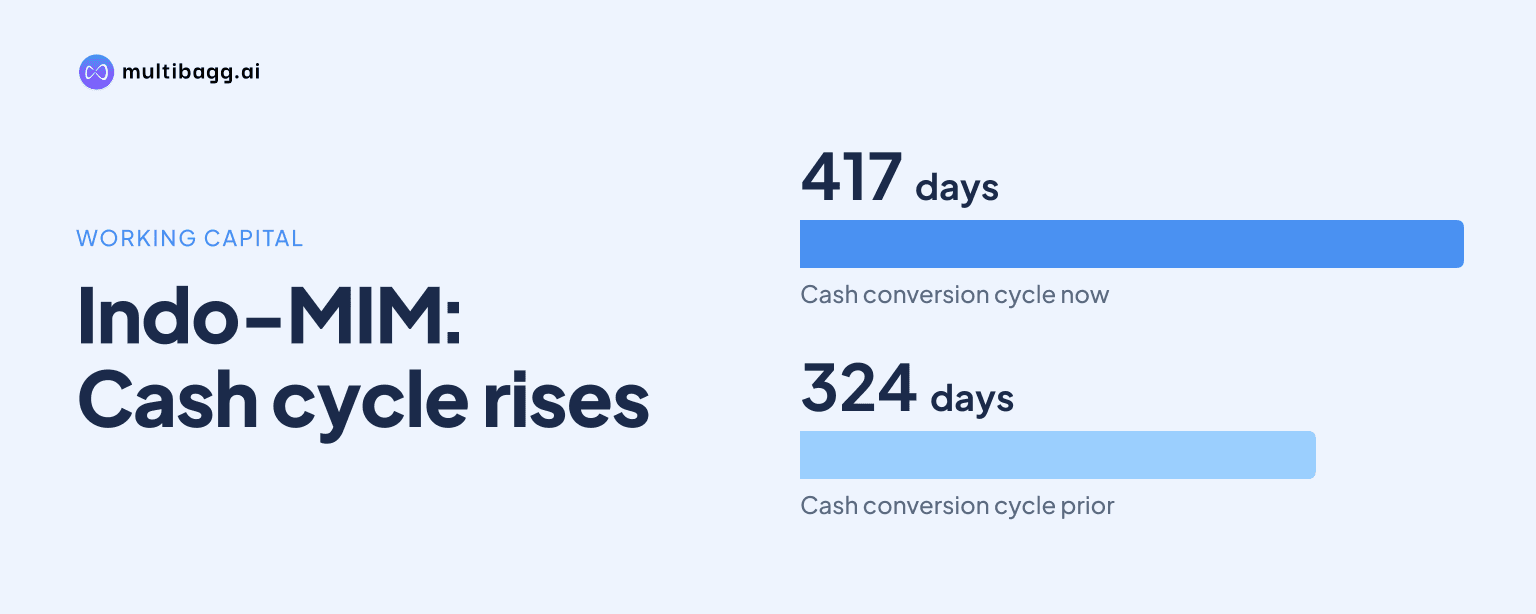
Indo-MIM Limited reduced debt-to-equity to 0.27x in H1 FY27 from 0.50x in H1 FY26, while its cash conversion cycle widened 93 days to 417 days as inventory days increased to 441. Operating cash flow was Rs 444.3 crore, and operating-cash-flow-to-EBITDA conversion fell to 55.3% from 97.4%.
Know Indo-MIM inside out
Results, valuation, peers and who's buying, in one view.
How far did Indo-MIM reduce leverage in H1 FY27?
Indo-MIM reduced debt-to-equity to 0.27x in H1 FY27, compared with 0.50x in both H1 FY26 and H1 FY25. Net debt divided by earnings before interest, tax, depreciation and amortisation, or EBITDA, also declined to 0.19x from 0.75x in H1 FY26. The presentation reports both ratios in its scorecard dated 30 September 2026.
The debt-to-equity reduction was 0.23x year on year, while net debt to EBITDA fell 0.56x. These movements occurred alongside higher reported return ratios: return on capital employed, or ROCE, rose to 36.5% in H1 FY27 from 30.8% in H1 FY26, and return on equity, also called return on net worth, increased to 26.3% from 22.9%.
Indo-MIM also reported profit after tax of Rs 455.3 crore in H1 FY27, described in the presentation as about 1.6 times H1 FY26 profit after tax of Rs 90 crore. Its H1 FY27 EBITDA margin was 32.0% and profit-after-tax margin was 18.2%, providing the earnings context for the return and net-debt ratios.
What happened to Indo-MIM borrowings at 30 September 2026?
Indo-MIM reported total borrowings of Rs 941 crore at 30 September 2026, compared with Rs 1,255 crore in the previous comparison shown in the presentation. This was a decline of Rs 314 crore, with working-capital loans accounting for most of the absolute reduction among the disclosed borrowing categories.
Working-capital loans fell to Rs 166.1 crore from Rs 402.9 crore, a reduction of Rs 236.8 crore. Term loans declined to Rs 769.2 crore from Rs 848.7 crore, while vehicle loans increased to Rs 5.7 crore from Rs 3.4 crore. Term loans therefore remained the largest component, representing 81.7% of current borrowings, compared with 67.6% in the previous comparison.
Indo-MIM disclosed Rs 400 crore of fresh-issue proceeds for debt repayment. The presentation also states that ICRA reaffirmed an AA+ stable rating for the company’s term-loan and working-capital facilities on 7 April 2026. It does not provide a debt bridge separating the effect of the fresh-issue proceeds, repayments, drawings and other movements during H1 FY27.
Got a follow-up? Ask IRIS
Why did Indo-MIM cash conversion cycle rise to 417 days?
Indo-MIM’s cash conversion cycle rose to 417 days in H1 FY27 from 324 days in H1 FY26, principally reflecting a 101-day increase in inventory days to 441. Debtor days rose five days to 64, while payable days increased 13 days to 88, providing only a partial offset to the higher inventory holding period.
The H1 FY27 cycle was 50 days below the 467 days reported in H1 FY25, but it reversed much of the improvement recorded in H1 FY26. Inventory days had fallen from 528 in H1 FY25 to 340 in H1 FY26 before increasing to 441 in H1 FY27. Over the same three periods, debtor days were 63, 59 and 64, respectively.
Working capital represented 33.7% of revenue in H1 FY27, up from 25.6% in H1 FY26. The 8.1-percentage-point increase in that ratio is consistent with the longer cash conversion cycle, as a larger share of revenue was represented by operating working capital than in the prior first half.
How did working-capital intensity affect Indo-MIM cash flow?
Indo-MIM generated operating cash flow of Rs 444.3 crore in H1 FY27, compared with Rs 567.1 crore in H1 FY26. Operating cash flow divided by EBITDA declined to 55.3% from 97.4%, which the presentation reports alongside the increase in working capital as a share of revenue and the 93-day widening in the cash conversion cycle.
Free cash flow was Rs 31.2 crore in H1 FY27, down from Rs 355.9 crore in H1 FY26. The decline of Rs 324.7 crore exceeded the Rs 122.8 crore reduction in operating cash flow. The source does not provide a reconciliation of capital expenditure, interest, taxes or other items that produced the change in free cash flow.
The lower cash-flow conversion was reported even as consolidated revenue rose 11.8% year on year to Rs 2,490.6 crore in H1 FY27 from Rs 2,226.8 crore. By segment, metal injection moulding revenue increased 19.8% to Rs 1,500.1 crore and investment casting revenue increased 36.0% to Rs 477.2 crore, while the Others segment declined 39.0% to Rs 281 crore.
Indo-MIM’s disclosed business model covers metal injection moulding, investment casting, precision machining, electronic components and additive manufacturing. It serves automotive, consumer, medical, aerospace and defence end markets, but reports one operating segment, Manufacturer of Precision Engineering Components. The presentation does not allocate the H1 FY27 inventory increase or 441 inventory days among those product lines or end markets.
Conclusion
Indo-MIM’s H1 FY27 figures show lower balance-sheet leverage alongside greater cash tied up in operations. Debt-to-equity fell to 0.27x and total borrowings declined to Rs 941 crore, but inventory days rose to 441, lifting the cash conversion cycle to 417 days and reducing operating-cash-flow-to-EBITDA conversion to 55.3%.
The next disclosures can clarify whether inventory days and working capital as a share of revenue move from 441 days and 33.7% toward H1 FY26 levels. Investors can also watch the application and timing of the disclosed Rs 400 crore fresh-issue proceeds for debt repayment, while management’s stated normal-course EBITDA margin framework remains 20% to 25%.