










Indo-MIM Limited H1 FY27 profit rises 57% as EBITDA margin expands
Key highlights
- Indo-MIM reported H1 FY27 consolidated PAT of Rs 455.31 crore, up 57.0% year on year.
- Consolidated revenue from operations increased 11.8% to Rs 2,490.58 crore in H1 FY27.
- Consolidated EBITDA margin expanded about 630 basis points to 32.0% from 25.7%.
- Consolidated net margin rose about 540 basis points to 18.2% from 12.8%.
powered by IRIS
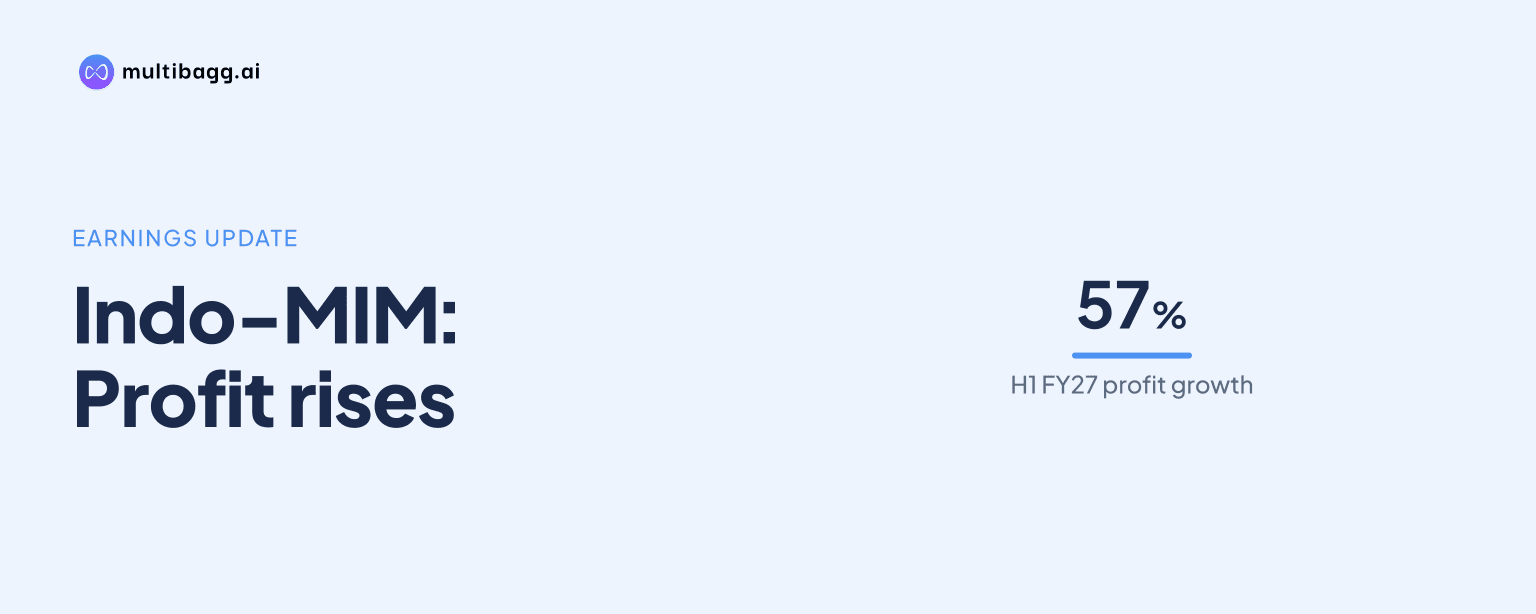
Indo-MIM Limited reported consolidated profit after tax of Rs 455.31 crore for H1 FY27 ended September 30, 2026, up 57.0% year on year, while EBITDA margin expanded about 630 basis points to 32.0% from 25.7%. Revenue from operations rose 11.8% to Rs 2,490.58 crore in the same period.
Know Indo-MIM inside out
Results, valuation, peers and who's buying, in one view.
How did Indo-MIM’s H1 FY27 revenue and profit change?
Indo-MIM’s consolidated revenue from operations increased 11.8% to Rs 2,490.58 crore in H1 FY27 from Rs 2,226.75 crore in H1 FY26, while profit after tax, or PAT, rose 57.0% to Rs 455.31 crore from Rs 290.03 crore. The Rs 263.83 crore increase in revenue was accompanied by a Rs 165.28 crore increase in PAT, meaning profit grew faster than sales in percentage terms.
The executive summary also reported revenue growth of 14.3% quarter on quarter and PAT growth of 100.0% quarter on quarter in H1 FY27, although it did not provide the quarterly base figures on the supplied pages. Basic earnings per share, or EPS, for the six-month period rose to Rs 9.34 from Rs 6.02, while diluted EPS increased to Rs 9.18 from Rs 5.88.
How much did Indo-MIM’s operating and net margins expand?
Indo-MIM’s consolidated EBITDA, or earnings before interest, tax, depreciation and amortisation, margin increased to 32.0% in H1 FY27 from 25.7% in H1 FY26, an expansion of about 630 basis points. EBITDA increased 37.9% to Rs 803.41 crore from Rs 582.42 crore, outpacing the 11.8% rise in revenue from operations.
Consolidated net margin widened to 18.2% from 12.8%, or about 540 basis points, as PAT reached Rs 455.31 crore. Profit before exceptional items and tax increased 30.2% to Rs 634.78 crore from Rs 487.41 crore. The presentation attributes EBITDA growth exceeding revenue growth to operating leverage and improved cost efficiency, but it does not provide a cost-line breakdown for H1 FY27.
What does the H1 FY27 result show about Indo-MIM’s earnings conversion?
Indo-MIM converted 11.8% consolidated revenue growth into 37.9% EBITDA growth and 57.0% PAT growth in H1 FY27. The reported change in EBITDA margin from 25.7% to 32.0% and in net margin from 12.8% to 18.2% shows that a larger share of revenue reached both the operating-profit and net-profit lines than in H1 FY26.
Management described the period as reflecting “healthy business momentum and strong execution” in its investor takeaway. Its presentation says operating-profit growth significantly outpaced sales growth, indicating operating leverage and enhanced cost efficiency. The supplied financial pages establish the reported growth rates and margins, but do not identify individual customer, product, pricing or expense drivers behind the improvement.
The difference between profit before exceptional items and tax and PAT was Rs 179.47 crore in H1 FY27, compared with Rs 197.38 crore in H1 FY26. However, the presentation does not disclose a tax-expense line, exceptional-item amount or reconciliation that would separately explain the movement between those profit measures over the six-month periods.
Got a follow-up? Ask IRIS
How did Indo-MIM’s standalone results compare with consolidated results?
Indo-MIM’s standalone revenue increased 7.5% to Rs 2,073.10 crore in H1 FY27 from Rs 1,927.70 crore, below the consolidated revenue growth rate of 11.8%. Standalone EBITDA rose 15.7% to Rs 741.60 crore from Rs 641.10 crore, while standalone EBITDA margin increased to 35.5% from 32.7%.
Standalone PAT grew 51.7% to Rs 443.50 crore in H1 FY27 from Rs 292.38 crore, and standalone net margin rose about 630 basis points to 21.2% from 14.9%. This left the standalone EBITDA margin of 35.5% above the consolidated 32.0% margin, while consolidated PAT growth of 57.0% exceeded standalone PAT growth of 51.7%.
Consolidated revenue exceeded standalone revenue by about Rs 417.48 crore in H1 FY27, compared with about Rs 299.05 crore in H1 FY26. The presentation lists Indo-MIM Inc. USA, Triax Industries and Conway Marsh Garrett Technologies in both periods, with Phoenix Deventures and Indo-MIM Arms Components additionally listed for H1 FY27, but does not provide subsidiary-level revenue or profit figures.
What margin range has Indo-MIM management indicated?
Indo-MIM management stated a normal-course EBITDA margin framework of 20% to 25%, while the margin-outlook page shows a 25.3% profit before exceptional items and tax, or PBEIT, margin for H1 FY27. The same page shows PBEIT margin of 21.5% in H1 FY26 and 20.7% in H1 FY25, with a displayed normalised midpoint of 22.5%.
Management said higher defence and medical contribution, including tooling income, lifted margin to about 16% in H1 FY27. The presentation also identifies years with a higher defence or medical revenue mix as a potential source of upside. These are management’s stated mix considerations, while the supplied pages do not quantify the revenue contribution of defence, medical or tooling.
For PAT margin, management disclosed a normal-course range of 13% to 18%, compared with the reported consolidated H1 FY27 net margin of 18.2%. The presentation shows PAT margin of 12.8% in H1 FY26 and 15.9% in H1 FY25, while its normalised midpoint is displayed as 15.6%.
Conclusion
Indo-MIM’s H1 FY27 result combined 11.8% consolidated revenue growth with 37.9% EBITDA growth and 57.0% PAT growth. The movement in EBITDA margin to 32.0% and net margin to 18.2% was the reported mechanism behind profit increasing faster than revenue, while standalone and consolidated results showed different growth rates and margin levels.
The next disclosed event was an analyst and investor earnings conference call scheduled for November 16, 2026 at 15:00 Indian Standard Time to discuss the unaudited results for the quarter and half year ended September 30, 2026. Investors will be able to watch for management’s further explanation of defence, medical and tooling contributions, as well as how the H1 margin outcome relates to its stated 20% to 25% EBITDA and 13% to 18% PAT margin frameworks.