










Interarch Building Solutions top-five share reaches 44% FY26
Key highlights
- Interarch’s top five customer groups supplied 44% of FY26 revenue, versus 25% in FY24.
- Repeat orders accounted for 72% of FY26 revenue, down from 82% in FY25.
- Industrial and manufacturing represented 87% of FY26 revenue, up from 68% in FY24.
- PEB contracts rose to Rs 1,618 crore in FY26 from Rs 1,225 crore in FY25.
powered by IRIS
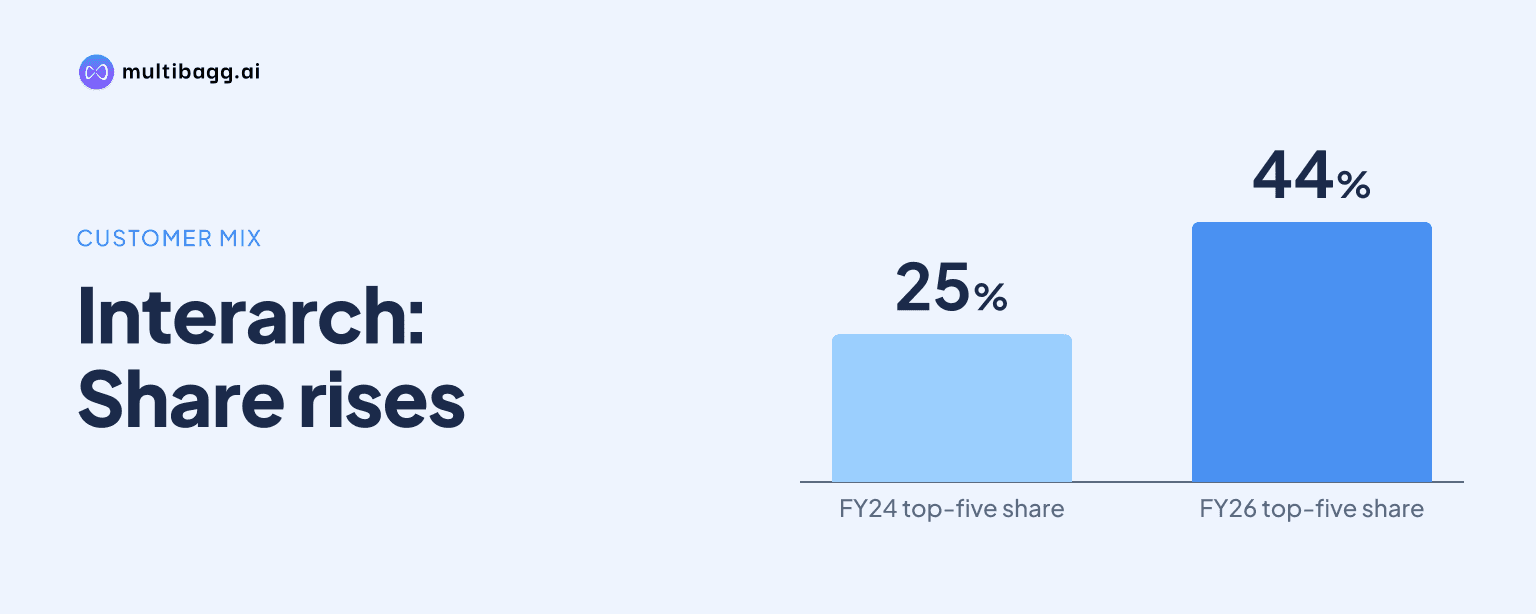
Interarch Building Solutions reported that its top five customer groups accounted for 44% of FY26 revenue, up from 27% in FY25 and 25% in FY24. The increase occurred as industrial and manufacturing end users represented 87% of FY26 revenue and repeat-order revenue fell to 72% from 82% a year earlier.
Know Interarch Building Solutions inside out
Results, valuation, peers and who's buying, in one view.
How concentrated was Interarch’s FY26 revenue?
Interarch’s top five customer groups supplied 44.0% of FY26 revenue, compared with 27.0% in FY25 and 25.0% in FY24. The share increased by 17 percentage points in FY26 and by 19 percentage points over two years. The presentation reports only the combined percentage, not revenue amounts or individual contributions for the five groups.
Interarch’s total revenue from operations increased to Rs 1,898 crore in FY26 from Rs 1,454 crore in FY25 and Rs 1,293 crore in FY24. The presentation lists Asian Paints, Aditya Birla Grasim, Tata Projects, Adverb Technologies, Unilever and Reliance Industries Limited as key customers, but does not identify which five customer groups made up the 44% measure. It also says the displayed logos are for representation purposes.
How did Interarch’s repeat-order revenue change in FY26?
Interarch’s repeat orders represented 72.0% of FY26 revenue, down from 82.0% in FY25 and 81.0% in FY24. New orders accounted for the remaining 28.0% in FY26, compared with 18.0% in FY25 and 19.0% in FY24. The 10-percentage-point fall in repeat-order share coincided with the 17-percentage-point increase in the top-five customer-group share.
Interarch defines repeat orders as orders placed by customers or customer groups that have ordered previously. This differs from the top-five metric, which measures the revenue share of the largest five groups. The presentation does not explain why repeat-order revenue declined, whether a major customer group was new, or whether ordering patterns changed within the five largest groups.
Which end-user industries drove Interarch’s FY26 revenue?
Industrial and manufacturing was Interarch’s largest end-user industry in FY26, representing 87% of revenue, up from 77% in FY25 and 68% in FY24. Infrastructure construction represented 11% in FY26, down from 21% in FY25 and 31% in FY24. The industrial and manufacturing share therefore increased by 19 percentage points over two years, while infrastructure construction fell by 20 percentage points.
Building construction accounted for 1% of FY26 revenue, others represented 2%, and other operating income was shown as 0% in the percentage mix. Building construction was 0% in FY24 and FY25, while the others category moved from negative 1% in FY24 to 2% in FY25 and FY26. The presentation does not provide customer concentration data separately for industrial, infrastructure or other end-user segments.
Interarch cites food-processing manufacturing in Muzaffarnagar, plastic-products manufacturing in Roorkee, solar photovoltaic module manufacturing in Dholera and Jaipur, and a data-centre building in Navi Mumbai among its execution examples. It also identifies industrial and logistics parks across Haryana, Punjab, Maharashtra and Tamil Nadu. No revenue amount, contract date or customer identity is provided for these individual projects.
Got a follow-up? Ask IRIS
Which Interarch revenue line increased most in FY26?
Pre-engineered building, or PEB, contracts were Interarch’s largest disclosed revenue line at Rs 1,618 crore in FY26, up from Rs 1,225 crore in FY25 and Rs 979 crore in FY24. The Rs 393 crore year-on-year increase in PEB contracts exceeded the Rs 47 crore increase in PEB sales, which reached Rs 258 crore in FY26 from Rs 211 crore in FY25.
Other operating income was Rs 22 crore in FY26, compared with Rs 18 crore in FY25 and Rs 17 crore in FY24. PEB sales remained below the Rs 297 crore reported in FY24, despite the FY26 recovery. The presentation does not attribute PEB contract growth to a specific customer group, end-user sector, geography or project size.
Interarch reported 2,46,000 metric tonnes per annum, or MTPA, of total existing installed capacity as of October 2025, with utilisable capacity of about 2,04,500 MTPA. It lists Gujarat Facility PEB Phase 2 for Q3FY27 with 20,000 MTPA of installed capacity and Andhra Pradesh Phase 2 HSS for Q4FY27 with 24,000 MTPA. The document provides no capacity-utilisation figure by facility or revenue line.
What financial context accompanied Interarch’s FY26 customer mix?
Interarch reported earnings before interest, tax, depreciation and amortisation, or EBITDA, of Rs 176 crore in FY26, up from Rs 136 crore in FY25, while its EBITDA margin was 9.3% versus 9.4%. Profit after tax increased to Rs 135 crore from Rs 108 crore, while the profit-after-tax margin declined to 7.1% from 7.4%. The presentation does not link these margin movements to the top-five customer groups.
For H1 FY27, Interarch reported revenue of Rs 965 crore, EBITDA of Rs 81 crore and profit after tax of Rs 59 crore. Net working-capital days increased to 86 in H1 FY27 from 66 in FY26 and 64 in FY25. Interarch also reported net debt-to-equity of negative 0.1 times in both FY26 and H1 FY27, but did not disclose any relationship between working capital, customer concentration or repeat orders.
Conclusion
Interarch’s FY26 data show higher concentration among its five largest customer groups, whose combined revenue share reached 44%, alongside a more industrial and manufacturing-led end-user mix at 87%. Revenue from operations rose to Rs 1,898 crore and PEB contracts rose to Rs 1,618 crore, while repeat orders declined to 72%. The disclosure establishes these aggregate shifts but does not identify the top-five groups or their individual revenue contributions.
The next disclosed operating milestones are Gujarat Facility PEB Phase 2 in Q3FY27 and Andhra Pradesh Phase 2 HSS in Q4FY27, with 20,000 MTPA and 24,000 MTPA of installed capacity respectively. Future disclosures may show whether added capacity changes the industrial revenue mix, the 44% top-five share, repeat-order revenue or H1 FY27 working-capital days of 86.