










IRIS H1 revenue rose 32% while profit after tax fell 95%
Key highlights
- IRIS H1FY27 revenue rose 32% to Rs 76.17 crore from Rs 57.49 crore.
- IRIS H1FY27 PAT fell 95% to Rs 12 lakh as depreciation reached Rs 3.30 crore.
- IRIS RegTech EBITDA moved to a Rs 2.16 crore profit from a Rs 21 lakh loss.
- IRIS recurring revenue increased to Rs 40.10 crore in H1FY27 from Rs 31.02 crore.
powered by IRIS
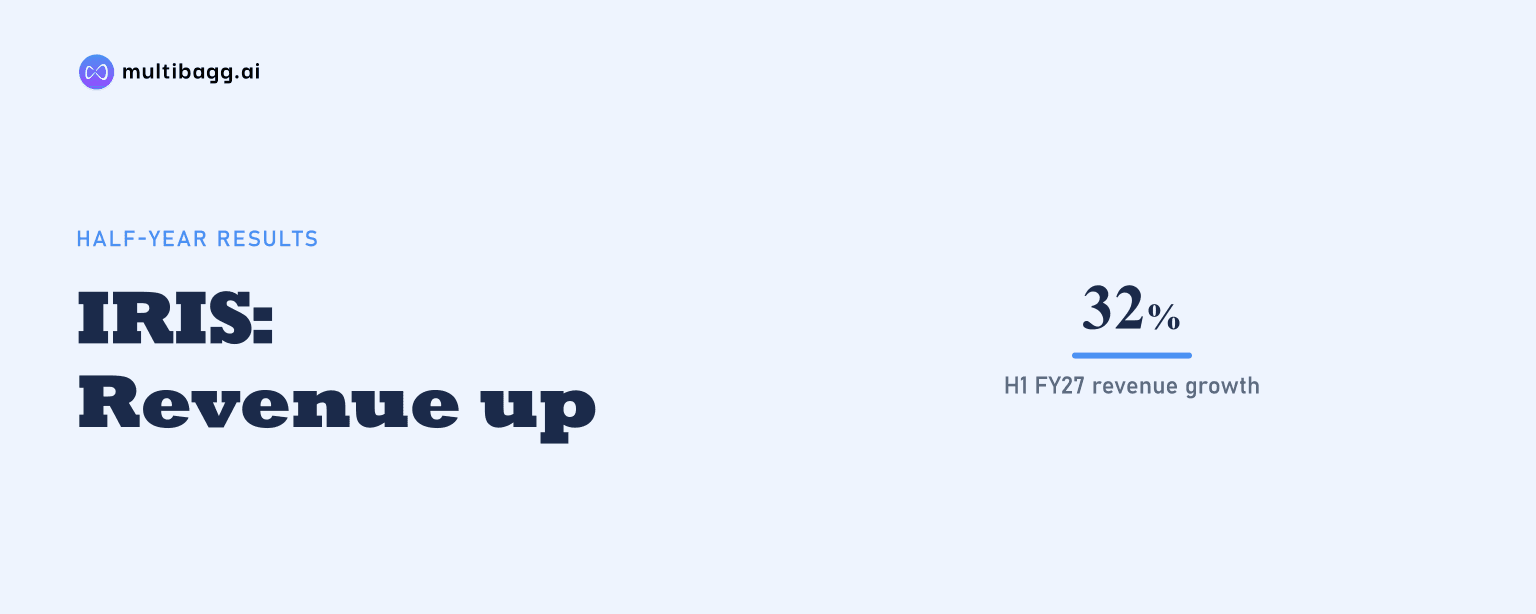
IRIS RegTech Solutions Limited reported revenue of Rs 76.17 crore in the first half of financial year 2027 (H1FY27), up 32% from H1FY26, but profit after tax fell 95% to Rs 12 lakh as depreciation rose to Rs 3.30 crore and finance cost reached Rs 81 lakh. EBITDA increased 20% to Rs 4.93 crore.
Know IRIS Regtech Solutions inside out
Results, valuation, peers and who's buying, in one view.
Why did IRIS profit after tax fall despite H1FY27 revenue growth?
Higher depreciation and finance costs reduced IRIS's H1FY27 profit after tax despite revenue growth and higher EBITDA. Revenue increased from Rs 57.49 crore in H1FY26 to Rs 76.17 crore in H1FY27, while earnings before interest, tax, depreciation and amortisation (EBITDA) rose from Rs 4.12 crore to Rs 4.93 crore. However, depreciation increased from Rs 1 crore to Rs 3.30 crore and finance cost increased from Rs 24 lakh to Rs 81 lakh.
These costs reduced profit before tax from Rs 2.88 crore in H1FY26 to Rs 82 lakh in H1FY27. Tax expense was Rs 70 lakh, compared with Rs 67 lakh a year earlier, leaving profit after tax (PAT) at Rs 12 lakh against Rs 2.21 crore. The EBITDA margin declined to 6% from 7%, while the PAT margin was reported at 0%, compared with 4% in H1FY26.
Total expenses rose 33% to Rs 71.24 crore, close to the 32% increase in revenue. Employee expenses rose 33% to Rs 41.54 crore from Rs 31.27 crore, while other expenses increased 34% to Rs 29.70 crore from Rs 22.10 crore. The presentation states that the figures cover continuing operations and exclude exceptional gains or losses.
How did IRIS perform in Q2FY27?
IRIS generated Rs 40.93 crore of revenue and Rs 1.09 crore of PAT in the second quarter of FY27 (Q2FY27), recovering from a Q1FY27 loss while remaining below Q2FY26 PAT. Quarterly revenue grew 16% from Rs 35.24 crore in Q1FY27 and 32% from Rs 31.10 crore in Q2FY26. PAT moved from a loss of Rs 97 lakh in Q1FY27 to a profit of Rs 1.09 crore, but was 41% lower than the Rs 1.84 crore reported in Q2FY26.
Quarterly EBITDA was Rs 4.10 crore, up from Rs 83 lakh in Q1FY27 and Rs 2.69 crore in Q2FY26. The EBITDA margin reached 10% in Q2FY27, compared with 2% in the preceding quarter and 9% a year earlier. Finance cost was Rs 47 lakh and depreciation was Rs 1.86 crore in Q2FY27, compared with Rs 8 lakh and Rs 51 lakh respectively in Q2FY26.
Recurring revenue reached Rs 21.71 crore in Q2FY27, compared with Rs 18.39 crore in Q1FY27 and Rs 16.85 crore in Q2FY26. For the six months, recurring revenue increased to Rs 40.10 crore from Rs 31.02 crore. Revenue from operations was Rs 71.49 crore in H1FY27, a 33% increase from Rs 53.76 crore in H1FY26.
Which IRIS segments drove H1FY27 performance?
SupTech and RegTech drove IRIS's H1FY27 segment expansion, while DataTech recorded lower revenue and a larger EBITDA loss. SupTech revenue increased from Rs 32.85 crore to Rs 41.26 crore, and its EBITDA increased from Rs 9.48 crore to Rs 11.70 crore. This made SupTech the largest reported segment by both H1FY27 revenue and EBITDA.
RegTech revenue rose from Rs 18.25 crore in H1FY26 to Rs 27.36 crore in H1FY27. Its EBITDA moved from a loss of Rs 21 lakh to a profit of Rs 2.16 crore, representing a shift to positive segment EBITDA. Over the same half-year comparison, IRIS's recurring revenue increased by Rs 9.08 crore.
DataTech revenue declined from Rs 89 lakh to Rs 82 lakh between H1FY26 and H1FY27. Its EBITDA loss widened from Rs 49 lakh to Rs 2.72 crore, an increase in the loss of Rs 2.23 crore. The presentation provides the three segment revenue and EBITDA figures but does not give a detailed explanation for the DataTech movement.
Got a follow-up? Ask IRIS
How did IRIS revenue mix change across geographies?
IRIS's H1FY27 revenue mix shifted away from Africa toward MENA, the Middle East and North Africa, the Americas and India. Africa's share declined to 31% from 43% in H1FY26, a fall of 12 percentage points. MENA increased to 17% from 9%, the largest reported gain in geographic share.
India represented 20% of H1FY27 revenue, up from 18%, while the Americas increased to 11% from 7%. Europe remained at 15% in both periods. APAC, or Asia-Pacific, declined to 6% from 8%, showing growth in several regional shares alongside lower relative exposure to Africa.
The mix data are percentages rather than geographic revenue amounts, so the presentation does not quantify revenue growth by individual region. It does show that the Africa share was still the largest at 31% in H1FY27, ahead of India at 20% and MENA at 17%. These proportions are presented alongside consolidated H1FY27 revenue of Rs 76.17 crore.
What changed in the IRIS balance sheet during H1FY27?
IRIS's consolidated balance sheet increased to Rs 277.41 crore at H1FY27 from Rs 252.71 crore at FY26. Total equity was Rs 202.15 crore, compared with Rs 200.73 crore at FY26, including other equity of Rs 181.56 crore. Current borrowings declined to Rs 92 lakh from Rs 1 crore over the same period.
Lease-related balances increased materially during the half year. Non-current lease liabilities rose to Rs 11.55 crore from Rs 42 lakh, while current lease liabilities increased to Rs 2.61 crore from Rs 23 lakh. Right-of-use assets rose to Rs 22.30 crore from Rs 8.66 crore, and other intangible assets increased to Rs 13.24 crore from Rs 9.46 crore.
Trade receivables increased to Rs 43.93 crore at H1FY27 from Rs 27.49 crore at FY26. Bank balances other than cash and cash equivalents rose to Rs 74.08 crore from Rs 32.03 crore, while investments decreased to Rs 55.33 crore from Rs 59.91 crore. Cash and cash equivalents were Rs 14.07 crore, compared with Rs 13.31 crore at FY26.
Conclusion
IRIS delivered a higher H1FY27 revenue base, including Rs 40.10 crore of recurring revenue, and its SupTech and RegTech businesses increased EBITDA. However, depreciation of Rs 3.30 crore, finance cost of Rs 81 lakh and total expenses of Rs 71.24 crore meant the EBITDA increase did not translate into comparable PAT, which was Rs 12 lakh.
What to watch next is whether management's disclosed investment in sales and marketing and expansion of partner channels coincide with sustained profitability after Q2FY27's 10% EBITDA margin and H1FY27's 6% margin. Management also cites new products, higher deal sizes and deeper engagement in its growth plan, but the presentation provides no quantified financial target or timing for those initiatives.