










IRM Energy CNG growth offsets industrial PNG volume decline in Q2
Key highlights
- IRM Energy’s Q2FY27 gas volume reached a quarterly record of 61.23 mmscm, up 12% year on year.
- CNG volume increased 25% to 39.73 mmscm, while commercial PNG volume rose 50% to 0.90 mmscm.
- Industrial PNG volume declined 8% year on year to 18.19 mmscm despite industrial connections rising 8% to 235.
- IRM Energy had 156 CNG stations and 576 dispensing points as of 30 September 2026, up 34% and 36%, respectively.
powered by IRIS
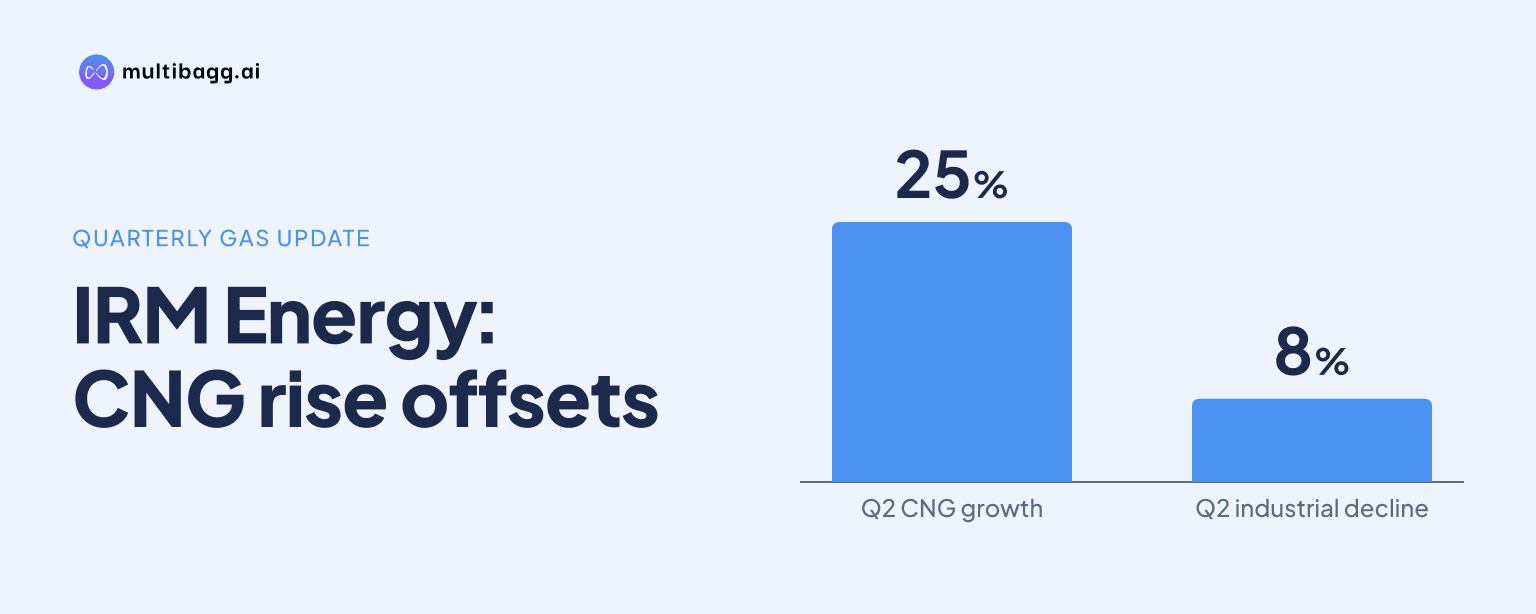
IRM Energy recorded its highest quarterly gas volume of 61.23 million metric standard cubic metres (mmscm) in Q2FY27, up 12% year on year. The increase was led by 25% growth in compressed natural gas (CNG) to 39.73 mmscm and 50% growth in commercial piped natural gas (PNG), while industrial PNG fell 8% to 18.19 mmscm.
Know IRM Energy inside out
Results, valuation, peers and who's buying, in one view.
What drove IRM Energy's record Q2FY27 gas volume?
CNG and commercial PNG were the direct drivers of IRM Energy's record 61.23 mmscm quarterly volume in Q2FY27. CNG supplied 39.73 mmscm, compared with 31.89 mmscm in Q2FY26, an increase of 7.84 mmscm. Commercial PNG rose to 0.90 mmscm from 0.60 mmscm over the same period. Together, these gains offset lower industrial PNG volumes and a marginal 1% year-on-year decline in domestic PNG.
The record followed sequential growth from 58.93 mmscm in Q1FY27 and extended the increase from 54.66 mmscm in Q2FY26. The comparable mix shows where the expansion occurred: CNG represented a calculated 64.9% of Q2FY27 volume, versus 58.3% in Q2FY26. Industrial PNG's calculated share declined to 29.7% from 36.1%, changing the composition of gas sold even as total volume rose.
How has IRM Energy's volume mix changed over time?
IRM Energy's longer-term data show CNG becoming the principal source of volume growth while industrial PNG has been broadly flat across two years. CNG volume increased from 99.79 mmscm in FY24 to 133.53 mmscm in FY26, a disclosed two-year compound annual growth rate (CAGR) of 16%. In H1FY27, CNG volume reached 79.06 mmscm, accounting for a calculated 65.8% of the 120.16 mmscm total reported for the half year.
Industrial PNG followed a different path. Its volume increased from 76.38 mmscm in FY24 to 85.07 mmscm in FY25, then declined to 78.13 mmscm in FY26, leaving the disclosed FY24-to-FY26 CAGR at 1%. H1FY27 industrial PNG was 34.69 mmscm, or a calculated 28.9% of total half-year volume, compared with CNG's 79.06 mmscm. Domestic PNG and commercial PNG also expanded over the two-year period, at disclosed CAGRs of 22% each, although their H1FY27 volumes of 4.74 mmscm and 1.67 mmscm remained smaller than CNG and industrial PNG.
The period comparison indicates a shift in contribution rather than uniform growth across customer groups. Total volume grew from 184.27 mmscm in FY24 to 223.67 mmscm in FY26, a disclosed 10% two-year CAGR. Over that span, CNG added 33.74 mmscm, while industrial PNG added 1.75 mmscm. In H1FY27, domestic and commercial PNG together contributed 6.41 mmscm, showing their faster percentage growth came from a substantially smaller base.
Got a follow-up? Ask IRIS
Why did IRM Energy industrial PNG volume fall despite more customers?
Industrial PNG volume fell because reported consumption declined even though IRM Energy increased its industrial customer count. Q2FY27 industrial PNG sales were 18.19 mmscm, down from 19.74 mmscm in Q2FY26, and H1FY27 volume was 34.69 mmscm. Meanwhile, industrial PNG connections increased 8% year on year to 235 as of 30 September 2026, separating customer additions from the volume result.
The quarterly figures show some recovery from Q1FY27, when industrial PNG volume was 16.50 mmscm, but not to the prior-year quarterly level. Q2FY27 volume was 1.69 mmscm higher sequentially yet 1.55 mmscm below Q2FY26. IRM Energy does not state a reason for the year-on-year industrial decline in the presentation, so the data support a volume and mix observation rather than an explanation based on demand, pricing, supply or specific industrial customers.
Domestic PNG was comparatively stable but did not provide material incremental volume in Q2FY27. It supplied 2.41 mmscm, compared with 2.43 mmscm a year earlier, despite domestic connections rising 14% to 89,308 as of 30 September 2026. Commercial PNG, by contrast, reached 0.90 mmscm after commercial connections rose 48% to 657. These differences show that connection growth across PNG categories did not translate into the same consumption trend during the quarter.
What does the Namakkal and Tiruchirappalli ramp-up add?
Namakkal and Tiruchirappalli add a new Tamil Nadu growth geography that IRM Energy identifies, alongside continued ramp-up in Banaskantha and Diu & Gir Somnath, as being on track. The Namakkal and Tiruchirappalli area has a stated population of 54 lakh and 11,231 CNG vehicles. The presentation does not disclose its individual volumes, so it cannot quantify how much of Q2FY27's 39.73 mmscm CNG volume came from this geography.
The disclosed operating actions point to institutional CNG demand as one mechanism for future volume growth. IRM Energy entered memorandums of understanding (MoUs) with TNSTC for captive CNG dispensing facilities in Namakkal and Trichy. During Q2FY27, 83 TNSTC buses were converted to CNG, taking the fleet to approximately 183 buses in Namakkal and 55 buses in Trichy. Management describes these facilities as creating a recurring institutional demand base.
Network additions provide the distribution capacity behind this plan. As of 30 September 2026, IRM Energy had 156 CNG stations, up 34% year on year, and 576 dispensing points, up 36%. It also reported incentives for 193 PNG customers who bought CNG vehicles or retrofitted existing vehicles during H1FY27, alongside campaigns at original equipment manufacturer dealerships and CNG stations. These measures align with the 25% CNG volume growth in Q2FY27, although the presentation does not allocate that growth by geography or programme.
Conclusion
IRM Energy's Q2FY27 record of 61.23 mmscm reflects a change in the sources of volume growth. CNG added 7.84 mmscm year on year and commercial PNG added 0.30 mmscm, while industrial PNG contracted by 1.55 mmscm. Across H1FY27, CNG reached 79.06 mmscm against 34.69 mmscm for industrial PNG, making the CNG-led mix increasingly important to total growth.
The next operating evidence will be whether the Tamil Nadu ramp-up converts its expanded station base and TNSTC bus programme into disclosed volumes. IRM Energy had converted 83 TNSTC buses in Q2FY27 and reported approximately 238 buses across Namakkal and Trichy, while its 156 CNG stations and 576 dispensing points were measured as of 30 September 2026. Industrial PNG volumes, which remained below the prior-year quarter despite 235 industrial connections, are the unresolved counterweight to the CNG expansion.