










JD Cables adds 28,000 km as both units exceed 82% utilisation
Key highlights
- JD Cables presented an additional 28,000 km of annual production capacity.
- Unit I produced 4,946 km at 82.43% utilisation in FY 2026.
- Unit II produced 18,603 km at 84.56% utilisation in FY 2026.
- JD Cables reported FY 26 cables-and-wires revenue contribution of Rs 252.5632 crore.
powered by IRIS
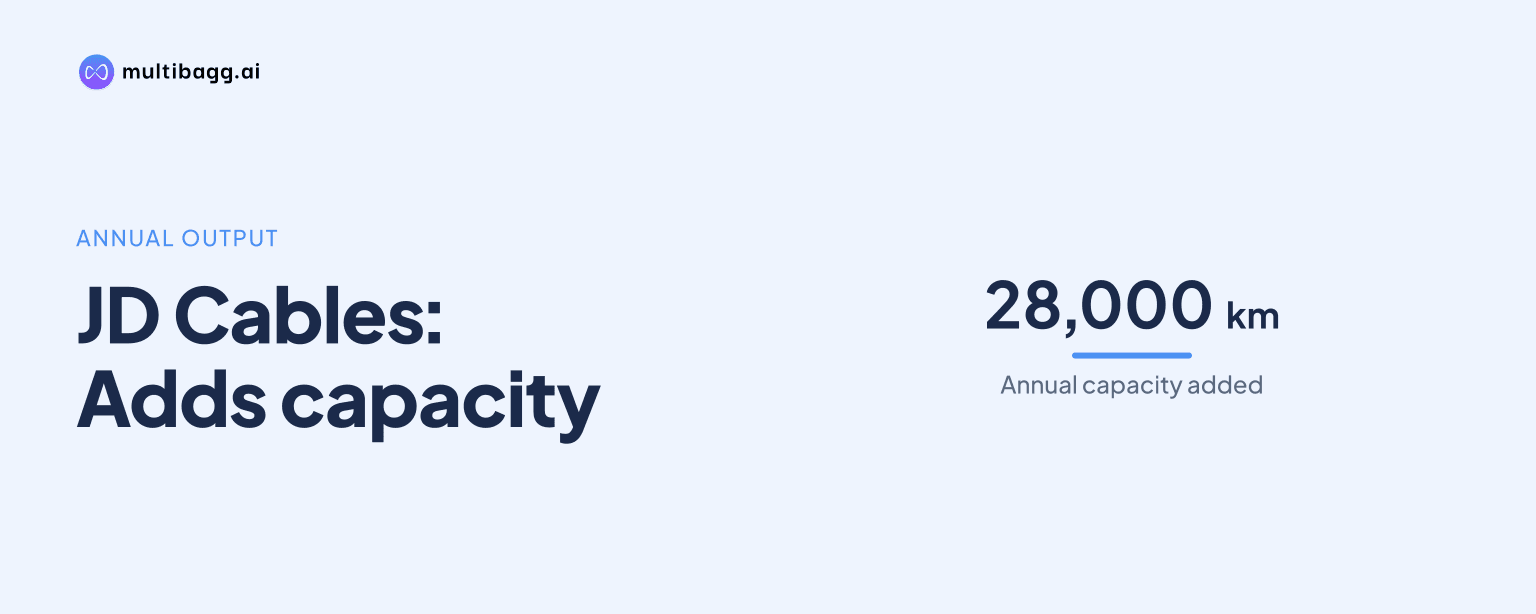
JD Cables presented an additional 28,000 km of annual production capacity while its two cable-and-conductor units recorded FY 2026 utilisation of 82.43% and 84.56%. Unit II produced 18,603 km against 22,000 km of installed capacity, and Unit I produced 4,946 km against 6,000 km.
Know JD Cables inside out
Results, valuation, peers and who's buying, in one view.
What capacity did JD Cables add?
JD Cables says it expanded installed production capacity by an additional 28,000 km per annum. The capacity-expansion page identifies High Temperature Low Sag (HTLS), Multi Voltage Covered Conductor (MVCC) and AL59 as products associated with the expansion statement. HTLS is described as a high-capacity conductor for efficient power transmission, MVCC as a covered conductor for power distribution, and AL59 as a high-strength aluminium-alloy conductor for overhead networks.
The presentation does not give a commissioning date, capital expenditure, plant location or product-wise allocation for the stated additional 28,000 km. Its FY 2026 facility table separately reports 28,000 km of combined installed capacity, comprising 6,000 km at Unit I and 22,000 km at Unit II. JD Cables does not state whether the expansion statement represents that reported total or capacity incremental to it.
How fully did JD Cables use its plants in FY 2026?
JD Cables used Unit I at 82.43% and Unit II at 84.56% in FY 2026. Unit I produced 4,946 km from 6,000 km of installed capacity, while Unit II produced 18,603 km from 22,000 km. Both facilities are classified in the table as producing cables and conductors.
Unit II was the larger operating site in FY 2026, accounting for 22,000 km of the two units' 28,000 km installed capacity. Its output of 18,603 km was 13,657 km above Unit I's 4,946 km, and its utilisation was 2.13 percentage points higher. The disclosure does not divide either unit's capacity or production between cables and individual conductor products.
How did JD Cables' capacity and production change?
JD Cables increased combined installed capacity to 28,000 km in FY 2025 from 15,000 km in FY 2024, entirely through Unit II. Unit II's capacity rose by 13,000 km to 22,000 km from 9,000 km, while Unit I remained at 6,000 km in FY 2024, FY 2025 and FY 2026.
Production rose at both facilities in FY 2026 after the larger Unit II capacity base was already reported in FY 2025. Unit I's output increased by 196 km to 4,946 km from 4,750 km, lifting utilisation to 82.43% from 79.17%. Unit II's output increased by 743 km to 18,603 km from 17,860 km, and utilisation rose to 84.56% from 81.18%.
The FY 2026 utilisation rates also exceeded FY 2024 levels at both facilities. Unit I moved from 79.80% in FY 2024 to 82.43% in FY 2026, while Unit II moved from 74.88% to 84.56%. The presentation provides utilisation percentages and kilometre output, but it does not disclose production days, downtime, utilisation methodology or unutilised capacity by product.
Got a follow-up? Ask IRIS
What products are made within JD Cables' portfolio?
JD Cables lists low-tension cross-linked polyethylene, or XLPE, and polyvinyl chloride, or PVC, insulated power cables and control cables. Its cables-and-wires range also includes low-tension aerial bunch cables and single-core service wires. The facility table groups all output under cables and conductors rather than assigning kilometre capacity to these cable categories.
The conductor portfolio includes Aluminium Conductor Steel Reinforced, All Aluminium Alloy Conductor, All Aluminium Conductor, AL59, MVCC and HTLS. JD Cables also states that its manufacturing operation has in-house testing laboratories and ISO 9001:2015 certification. Neither the product portfolio page nor the capacity table reports revenue, volume or installed capacity for a named cable or conductor type.
What does JD Cables' revenue mix show?
JD Cables reported cables-and-wires revenue contribution of Rs 252.5632 crore in FY 26, compared with Rs 202.1327 crore in FY 25. Aluminium-conductor revenue contribution was Rs 81.5235 crore in FY 26, compared with Rs 48.3931 crore in FY 25. The two disclosed product groups therefore both recorded higher revenue contribution year on year.
Cables and wires remained the larger disclosed revenue group in FY 26, exceeding aluminium conductors by Rs 171.0397 crore. Aluminium conductors added Rs 33.1304 crore of revenue contribution from FY 25, while cables and wires added Rs 50.4305 crore. The presentation does not connect these revenue figures to Unit I or Unit II, or identify how much of either segment relates to HTLS, MVCC or AL59.
JD Cables says it is an approved vendor for multiple State Electricity Boards and serves more than 15 states. The presentation identifies power transmission and distribution, grid strengthening, rural electrification, renewable projects, construction, data centres and telecom networks as relevant demand channels. It does not disclose customer names, order values, orders linked to the 28,000 km statement or a sales-volume target for the added capacity.
Conclusion
JD Cables' presentation places a stated additional 28,000 km of annual production capacity alongside FY 2026 utilisation above 82% at both reported units. Unit II is the main production base at 22,000 km of installed capacity and 18,603 km of output, while Unit I has 6,000 km of capacity and 4,946 km of output. Both cables and wires and aluminium conductors recorded higher FY 26 revenue contribution than in FY 25.
The key item to watch is a future disclosure that reconciles the 28,000-km expansion statement with the FY 2026 combined installed capacity of 28,000 km. JD Cables has not disclosed when this capacity was commissioned, whether it is additional to the facility-table total, or its allocation among HTLS, MVCC, AL59 and other products. Further unit-level or product-level volume data would clarify how the capacity plan converts into output and revenue.