










Kellton digital transformation reaches 85.6% of Q2 revenue
Key highlights
- Kellton's digital transformation revenue share rose to 85.6% in Q2 FY27 from 83.1% in Q2 FY26.
- The USA contributed 82.4% of Kellton's Q2 FY27 revenue, compared with 81.5% in Q1 FY27.
- Onshore revenue accounted for 81.3% of Q2 FY27 revenue, while offshore revenue accounted for 7.6%.
- Kellton reported Q2 FY27 total revenue of Rs 320.6 crore, up 6.5% year on year.
powered by IRIS
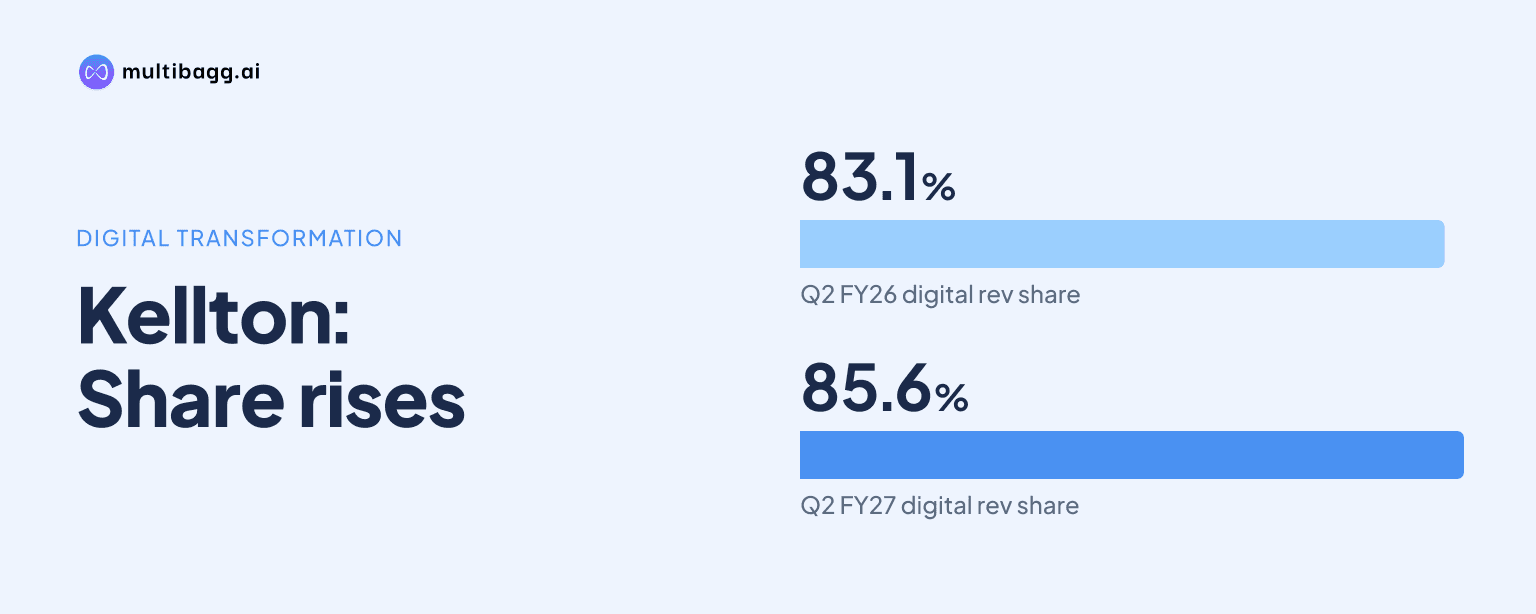
Kellton reported that digital transformation generated 85.6% of revenue in Q2 FY27, up from 83.1% in Q2 FY26, as total revenue rose 6.5% year on year to Rs 320.6 crore. The same quarter drew 82.4% of revenue from the USA and 81.3% from onshore revenue.
Know Kellton Tech Solutions inside out
Results, valuation, peers and who's buying, in one view.
How did Kellton's business-segment mix change in Q2 FY27?
Kellton's digital transformation share rose to 85.6% in Q2 FY27 from 83.9% in Q1 FY27 and 83.1% in Q2 FY26. The sequential increase was 1.7 percentage points and the year-on-year increase was 2.5 percentage points. Total revenue was Rs 320.6 crore in Q2 FY27, compared with Rs 316.3 crore in Q1 FY27 and Rs 300.9 crore in Q2 FY26.
Enterprise Solutions accounted for 12.5% of Q2 FY27 revenue, down from 13.3% in the preceding quarter and 13.8% a year earlier. Consulting Income represented 2.0%, versus 2.8% in Q1 FY27 and 3.1% in Q2 FY26. Together, these two segments made up 14.5% of Q2 FY27 revenue, compared with 16.1% in Q1 FY27 and 16.9% in Q2 FY26.
The shift occurred alongside two disclosed engagements involving technology delivery. Kellton won work with a seed engineering company to support five applications, including three backend systems and two customer-facing applications for retailer and distributor networks. It also disclosed engineering and research-and-development work for a global hearing aid manufacturer across software development, firmware engineering, manual testing and test automation.
Which geographies generated Kellton's Q2 FY27 revenue?
Kellton derived 82.4% of Q2 FY27 revenue from the USA, compared with 81.5% in Q1 FY27 and 82.2% in Q2 FY26. The USA share increased 0.9 percentage points from the prior quarter and 0.2 percentage points from a year earlier. The presentation reports geography as a revenue percentage rather than as a rupee amount.
India & APAC, meaning India and Asia-Pacific, contributed 14.4% in Q2 FY27, up from 14.2% in Q1 FY27 and 13.6% in Q2 FY26. Europe accounted for 4.2%, unchanged year on year and down from 4.3% in Q1 FY27. The USA remained the largest reported geography, exceeding India & APAC by 68.0 percentage points and Europe by 78.2 percentage points in Q2 FY27.
The three reported geography shares total 101.0% in Q2 FY27, as they also do in Q1 FY27 and Q2 FY26 based on the presentation's rounded percentages. That rounding means the data should be read as a mix indicator rather than a basis for deriving exact geographical revenue amounts. Kellton did not identify individual USA, India & APAC or European customers in these tables.
Was Kellton's revenue mix still led by onshore work?
Kellton's onshore revenue accounted for 81.3% of Q2 FY27 revenue, down marginally from 81.4% in Q1 FY27 and 81.6% in Q2 FY26. Onshore revenue therefore remained above four-fifths of the mix across all three disclosed quarters. The change from Q2 FY26 was a decline of 0.3 percentage points.
Domestic revenue represented 11.1% in Q2 FY27, compared with 11.2% in Q1 FY27 and 11.0% in Q2 FY26. Offshore revenue was 7.6%, up from 7.4% in both comparison periods. The 0.2-percentage-point quarterly gain in offshore revenue accompanied 0.1-percentage-point reductions in both domestic and onshore revenue.
Onshore revenue exceeded the combined domestic and offshore share of 18.7% by 62.6 percentage points in Q2 FY27. The corresponding gap was 63.2 percentage points in Q2 FY26, when onshore represented 81.6% and domestic plus offshore represented 18.4%. This indicates only limited movement in the delivery-location mix despite the 6.5% year-on-year increase in quarterly revenue.
Got a follow-up? Ask IRIS
How concentrated was Kellton's client revenue in Q2 FY27?
Kellton's top five clients generated 15.5% of Q2 FY27 revenue, compared with 15.0% in Q1 FY27 and 15.8% in Q2 FY26. The share increased 0.5 percentage points sequentially but was 0.3 percentage points below the prior-year quarter. The presentation does not name these clients or provide their individual revenue contributions.
The top 10 clients accounted for 25.9% of Q2 FY27 revenue, marginally above 25.8% in Q1 FY27 and 25.7% in Q2 FY26. Revenue outside the top 10 client group was consequently 74.1%, compared with 74.2% in Q1 FY27 and 74.3% a year earlier. The data show that the top-10 share moved by only 0.2 percentage points over the year.
Clients ranked six to 10 accounted for the 10.4 percentage-point difference between the top-10 and top-five groups in Q2 FY27. That difference was 10.8 percentage points in Q1 FY27 and 9.9 percentage points in Q2 FY26. The presentation provides concentration percentages only, so it does not establish whether movements reflected changed spending by existing clients or changes in the client rankings.
How did revenue and profit move alongside the Q2 FY27 mix?
Kellton reported Q2 FY27 total revenue of Rs 320.6 crore, up 1.4% from Rs 316.3 crore in Q1 FY27 and 6.5% from Rs 300.9 crore in Q2 FY26. Net revenue was Rs 320.1 crore, compared with Rs 315.6 crore sequentially and Rs 299.7 crore a year earlier. The higher digital transformation share therefore coincided with revenue growth against both disclosed comparison quarters.
Earnings before interest, taxes, depreciation and amortisation, or EBITDA, was Rs 38.7 crore in Q2 FY27, compared with Rs 35.2 crore in Q1 FY27 and Rs 37.8 crore in Q2 FY26. EBITDA margin was 12.1%, up from 11.1% sequentially but below 12.6% a year earlier. Profit after tax was Rs 23 crore, versus Rs 22.5 crore in Q1 FY27 and Rs 24.1 crore in Q2 FY26, while profit-after-tax margin was 7.2%, 7.1% and 8.0%, respectively.
For H1 FY27, revenue from operations was Rs 635.7 crore, compared with Rs 595.2 crore in H1 FY26, while total income rose to Rs 636.8 crore from Rs 597.1 crore. EBITDA was Rs 73.6 crore, marginally below Rs 73.7 crore a year earlier, and profit after tax was Rs 45.2 crore versus Rs 46.8 crore. H1 EBITDA margin was 11.6%, compared with 12.4%, and profit-after-tax margin was 7.1%, compared with 7.9%.
Conclusion
Kellton's Q2 FY27 mix was centred on digital transformation, the USA and onshore revenue, with reported shares of 85.6%, 82.4% and 81.3%, respectively. Digital transformation gained share as Enterprise Solutions and Consulting Income declined, while client concentration and delivery-location mix changed only modestly. Total revenue increased to Rs 320.6 crore, although year-on-year quarterly and half-year profit comparisons were lower.
The next results disclosure will show whether digital transformation remains above its Q2 FY27 level of 85.6% and whether the USA and onshore shares continue near 82.4% and 81.3%. Investors can also watch for further information on the five-application seed engineering engagement and the hearing-aid engineering work, because Kellton has not disclosed their contract values, duration or revenue contribution.