










Kellton Q2 revenue rises 6.5% while H1 PAT falls year on year
Key highlights
- Kellton reported Q2 FY27 total revenue of Rs 320.6 crore, up 6.5% year on year.
- Q2 FY27 EBITDA was Rs 38.7 crore and EBITDA margin rose to 12.1% from 11.1% in Q1 FY27.
- H1 FY27 PAT was Rs 45.2 crore, down from Rs 46.8 crore in H1 FY26.
- Digital transformation contributed 85.6% of Q2 FY27 revenue and the United States contributed 82.4%.
powered by IRIS
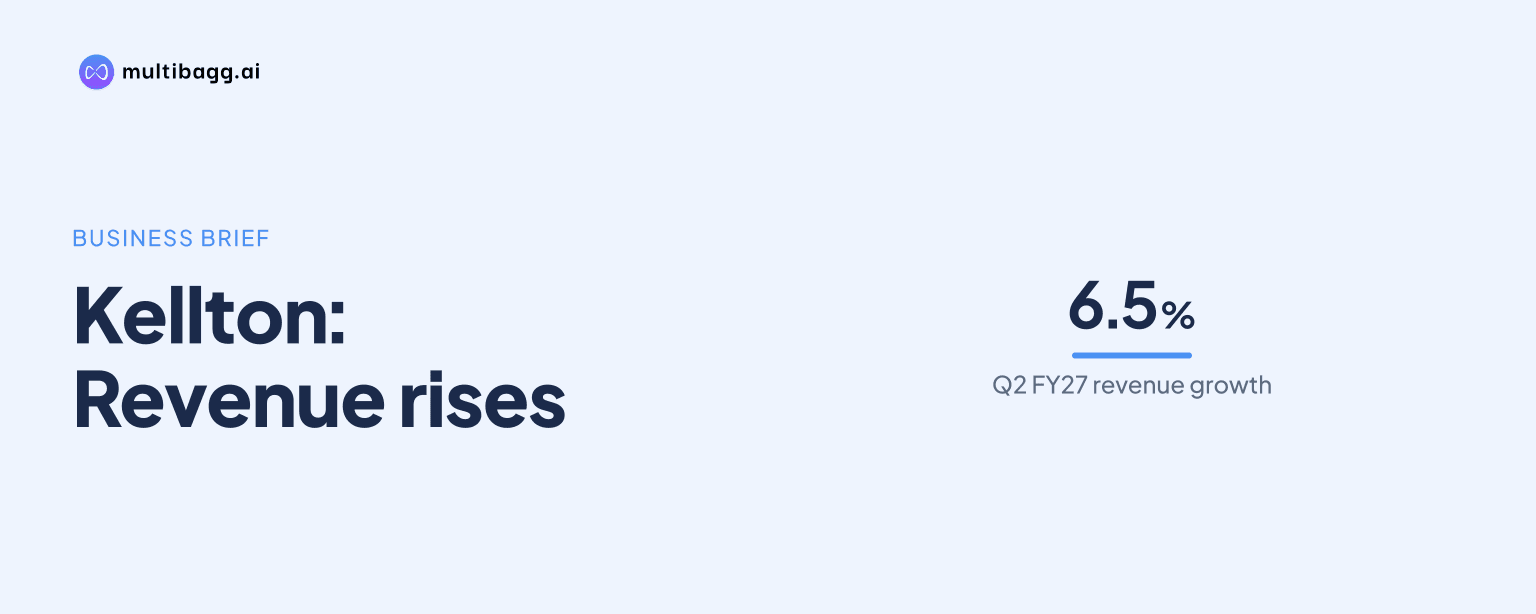
Kellton Tech Solutions Limited reported Q2 FY27 total revenue of Rs 320.6 crore for the quarter ended September 30, 2026, up 6.5% year on year, while H1 FY27 profit after tax fell to Rs 45.2 crore from Rs 46.8 crore. The quarter brought sequential margin improvement, but first-half earnings remained below the prior-year period.
Know Kellton Tech Solutions inside out
Results, valuation, peers and who's buying, in one view.
What did Kellton report in Q2 FY27?
Kellton reported Q2 FY27 total revenue of Rs 320.6 crore, earnings before interest, tax, depreciation and amortisation (EBITDA) of Rs 38.7 crore, and profit after tax (PAT) of Rs 23 crore. Total revenue rose from Rs 300.9 crore in Q2 FY26 and from Rs 316.3 crore in Q1 FY27, representing the company-reported 6.5% year-on-year increase and 1.4% sequential increase.
Q2 FY27 EBITDA was Rs 38.7 crore, compared with Rs 37.8 crore a year earlier and Rs 35.2 crore in Q1 FY27. Profit before tax (PBT) was Rs 29 crore, against Rs 29.1 crore in Q2 FY26 and Rs 25.9 crore in Q1 FY27. PAT of Rs 23 crore was Rs 1.1 crore below the prior-year quarter's Rs 24.1 crore but Rs 0.5 crore above the preceding quarter's Rs 22.5 crore.
How did Kellton's H1 FY27 earnings compare with H1 FY26?
Kellton's H1 FY27 total income increased to Rs 636.8 crore from Rs 597.1 crore in H1 FY26, while EBITDA edged down by Rs 10 lakh to Rs 73.6 crore. Revenue from operations rose to Rs 635.7 crore from Rs 595.2 crore, whereas other income declined to Rs 1.1 crore from Rs 1.9 crore, according to the historical consolidated income statement.
PBT declined to Rs 54.5 crore in H1 FY27 from Rs 56.1 crore in H1 FY26, while PAT fell to Rs 45.2 crore from Rs 46.8 crore. Tax was unchanged at Rs 9.3 crore in both half-year periods. Diluted earnings per share (EPS) declined to Rs 0.85 from Rs 0.89, and total comprehensive income was Rs 44.8 crore, compared with Rs 49.8 crore a year earlier.
The presentation's key-metrics page describes H1 FY27 total revenue as Rs 636.8 crore and assigns 6.6% H1 growth. Its historical income statement instead identifies Rs 635.7 crore as revenue from operations and Rs 636.8 crore as total income. The Rs 1.1 crore difference is H1 FY27 other income, so the two figures measure different lines in the income statement.
How did Kellton's margins and costs change?
Kellton's Q2 FY27 EBITDA margin increased to 12.1% from 11.1% in Q1 FY27, but remained below 12.6% in Q2 FY26. Its PAT margin was 7.2%, compared with 7.1% sequentially and 8.0% a year earlier. The quarter therefore showed a 1 percentage point sequential EBITDA-margin increase and a 0.1 percentage point sequential PAT-margin increase.
For H1 FY27, the historical income statement reports an EBITDA margin of 11.6%, compared with 12.4% in H1 FY26, and a PAT margin of 7.1%, compared with 7.9%. The key-metrics page reports H1 FY26 EBITDA margin at 12.3% and PAT margin at 7.8%, creating a 0.1 percentage point difference from the historical statement for that comparative period. Both presentation pages show lower H1 FY27 margins than the prior year.
Total expenses increased to Rs 563.2 crore in H1 FY27 from Rs 523.4 crore in H1 FY26 as total income rose by Rs 39.7 crore. Depreciation increased to Rs 7.8 crore from Rs 7.7 crore and finance cost rose to Rs 11.3 crore from Rs 9.9 crore. The presentation does not assign the EBITDA, PBT or PAT changes to a particular expense category.
Got a follow-up? Ask IRIS
What was Kellton's Q2 FY27 revenue mix?
Kellton's digital transformation segment generated 85.6% of Q2 FY27 revenue, up from 83.1% in Q2 FY26 and 83.9% in Q1 FY27. Enterprise solutions represented 12.5%, down from 13.8% a year earlier and 13.3% sequentially. Consulting income accounted for 2.0%, compared with 3.1% in Q2 FY26 and 2.8% in Q1 FY27.
The United States contributed 82.4% of Q2 FY27 revenue, compared with 82.2% in Q2 FY26 and 81.5% in Q1 FY27. India and Asia-Pacific represented 14.4%, up from 13.6% a year earlier, while Europe accounted for 4.2%, unchanged from Q2 FY26. The United States was therefore Kellton's largest disclosed geography in the September 2026 quarter.
Onshore delivery represented 81.3% of Q2 FY27 revenue, down from 81.6% in Q2 FY26, while offshore delivery rose to 7.6% from 7.4%. Domestic revenue was 11.1%, compared with 11.0% a year earlier. The top five clients accounted for 15.5% of revenue against 15.8% in Q2 FY26, while the top 10 clients accounted for 25.9%, up from 25.7%.
What new engagements did Kellton disclose?
Kellton disclosed a new engagement with a premium automotive transportation company involving a digital-platform audit and managed information-technology infrastructure support and maintenance. The initial phase assesses existing features and functionality, identifies gaps, and recommends features and workflow improvements. Kellton stated that this phase contains no development work.
Kellton also disclosed on-site quality engineering for a Saudi Arabian low-cost airline's customer-facing application. Its quality-assurance professionals are deployed at the client's locations, and Kellton said the team is expected to grow once the application programme's scope is confirmed. The presentation provides no contract value, duration or revenue contribution for this engagement.
Other disclosed work includes support for five applications at a seed engineering company, comprising three backend systems and two customer-facing applications for retailer and distributor networks. Kellton is also supporting a global hearing-aid manufacturer through its India operations with software development, firmware engineering, manual testing and test automation. No financial contribution was disclosed for either engagement.
Conclusion
Kellton's Q2 FY27 results combined revenue growth of 6.5% and a sequential EBITDA-margin increase to 12.1% with lower year-on-year quarterly PAT and lower H1 earnings. First-half total income increased by Rs 39.7 crore, but EBITDA declined by Rs 10 lakh and PAT declined by Rs 1.6 crore, while finance cost increased by Rs 1.4 crore.
The next results will show whether Kellton can sustain the Q2 increase from an 11.1% EBITDA margin in Q1 FY27 to 12.1% in Q2 FY27. Management also said the Saudi airline quality-engineering team is expected to grow after programme scope is confirmed, but the presentation gives no timing, contract value or financial target for that potential expansion.