










KPR reports 40% H1 FY27 PAT rise as EBITDA margin hits 24.2%
Key highlights
- KPR’s H1FY27 revenue from operations rose 14% year on year to Rs 3,875.26 crore.
- KPR’s H1FY27 EBITDA increased about 40% to Rs 956.39 crore, lifting the EBITDA margin to 24.2% from 19.8%.
- KPR’s Q2FY27 EBITDA margin reached 27.5%, compared with 20.8% in Q1FY27.
- KPR’s inventories fell to Rs 1,024.00 crore from Rs 1,844.00 crore at FY2026, while total borrowings declined to Rs 340.30 crore from Rs 596.10 crore.
powered by IRIS
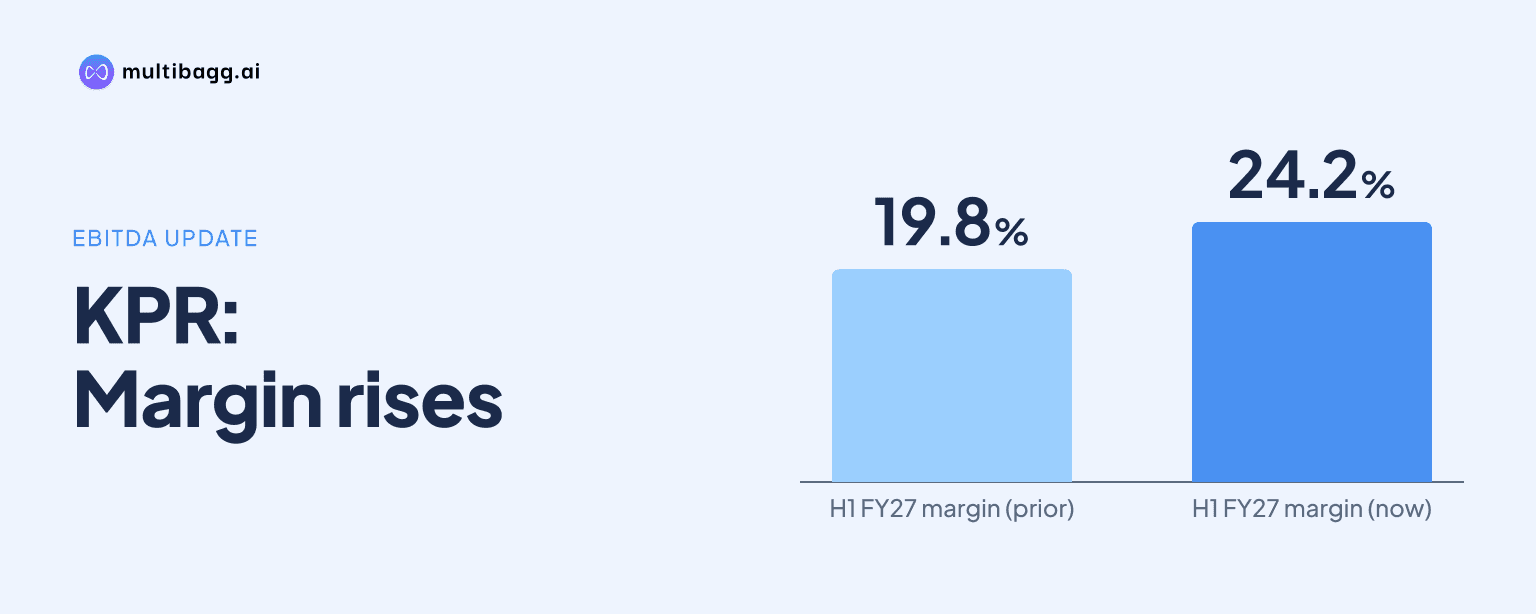
K.P.R. Mill Limited (KPR) reported first-half FY27 profit after tax of Rs 603.54 crore, 40% above H1FY26, as earnings before interest, tax, depreciation and amortisation margin rose to 24.2% from 19.8%. Net cash from operating activities was Rs 1,448.71 crore, including a Rs 569.42 crore working-capital inflow.
Know K P R Mill inside out
Results, valuation, peers and who's buying, in one view.
How did H1FY27 earnings change?
KPR’s H1FY27 revenue from operations increased 14% year on year to Rs 3,875.26 crore, while profit after tax, or PAT, increased about 40% to Rs 603.54 crore. Earnings before interest, tax, depreciation and amortisation, or EBITDA, rose about 40% to Rs 956.39 crore from Rs 684.39 crore, outpacing revenue growth and increasing the EBITDA margin by 4.4 percentage points.
The margin expansion came with total income rising to Rs 3,959.13 crore from Rs 3,458.21 crore. Finance cost was nearly unchanged at Rs 26.30 crore versus Rs 26.14 crore, while depreciation and amortisation increased to Rs 112.14 crore from Rs 107.05 crore. Profit before tax was Rs 817.95 crore in H1FY27, compared with Rs 1,134.00 crore reported for the full FY26.
Quarterly data shows that the second quarter contributed a higher margin than the first quarter. Q2FY27 EBITDA was Rs 546.81 crore and the EBITDA margin was 27.5%, compared with Rs 409.58 crore and 20.8% in Q1FY27. Q2FY27 PAT of Rs 345.00 crore also exceeded Rs 258.54 crore in Q1FY27, while revenue from operations was broadly steady at Rs 1,939.74 crore versus Rs 1,935.52 crore.
Which businesses recorded higher H1FY27 sales?
KPR disclosed higher sales values in yarn and fabric, sugar and ethanol, while garment sales value increased modestly. Yarn and fabric sales value rose to Rs 1,125 crore in H1FY27 from Rs 959 crore in H1FY26, although volume was slightly lower at 36,574 metric tonnes, or MT, from 36,729 MT.
Garment sales value increased to Rs 1,707 crore from Rs 1,693 crore, and garment volume rose to 90.30 million garments from 89.26 million garments. The Rs 14 crore increase in garment sales value was smaller than the Rs 166 crore increase in yarn and fabric sales value, but both product lines recorded higher sales values in H1FY27.
Sugar sales value rose to Rs 416 crore from Rs 343 crore, with volume increasing to 99,528 MT from 88,496 MT. Ethanol sales value increased to Rs 400 crore from Rs 248 crore, while ethanol volume rose to 643.73 lakh litres from 402.97 lakh litres. These segment movements occurred during the same H1FY27 period in which consolidated revenue from operations increased by Rs 476.96 crore year on year.
Got a follow-up? Ask IRIS
What changed in KPR’s financial position?
KPR’s current assets declined to Rs 1,976.90 crore in H1FY27 from Rs 2,753.30 crore at FY2026, chiefly alongside lower inventories. Inventories fell to Rs 1,024.00 crore from Rs 1,844.00 crore, while trade receivables decreased to Rs 615.60 crore from Rs 639.90 crore. Other current assets increased to Rs 337.30 crore from Rs 269.40 crore.
Net current assets therefore decreased to Rs 1,585.30 crore from Rs 2,366.60 crore, and capital employed declined to Rs 4,193.90 crore from Rs 5,015.20 crore. Total current liabilities were Rs 391.60 crore in H1FY27, compared with Rs 386.70 crore at FY2026, as trade payables declined to Rs 220.50 crore and other current liabilities increased to Rs 171.10 crore.
Total borrowings fell to Rs 340.30 crore from Rs 596.10 crore. Long-term borrowings were Rs 11.10 crore versus Rs 25.80 crore, while short-term borrowings were Rs 329.20 crore versus Rs 570.30 crore. KPR reported net borrowings, or net debt, of negative Rs 2,182.10 crore, compared with negative Rs 834.80 crore at FY2026, after fixed deposits with banks and non-banking financial companies reached Rs 1,511.20 crore and cash and cash equivalents in mutual fund investments reached Rs 1,011.10 crore.
How did operating cash flow develop in H1FY27?
KPR generated Rs 1,448.71 crore of net cash flow from operating activities in H1FY27, compared with Rs 1,107.84 crore reported for full FY26. The periods are not like-for-like because one covers six months and the other a full financial year, but H1FY27 included a Rs 569.42 crore positive change in operating assets and liabilities, against a Rs 200.05 crore negative change in FY26.
Operating profit before working-capital changes was Rs 879.29 crore in H1FY27, compared with Rs 1,307.89 crore in FY26. H1FY27 depreciation and amortisation added back Rs 112.14 crore, while other non-cash adjustments were negative Rs 50.80 crore. The presentation reported no doubtful-debt provision in H1FY27, compared with Rs 5.30 crore in FY26.
Investing activities used Rs 1,088.71 crore in H1FY27, including Rs 876.50 crore for investments or redemptions of mutual funds and Rs 76.77 crore for property, plant and equipment purchases. Financing activities used a further Rs 366.33 crore. As a result, cash and cash equivalents decreased by Rs 6.33 crore to Rs 57.53 crore at the end of H1FY27 from Rs 63.86 crore at the beginning of the year.
Conclusion
KPR’s first-half results show profit growth exceeding revenue growth, with PAT rising to Rs 603.54 crore and EBITDA margin increasing to 24.2%. The disclosed sales data shows higher values across yarn and fabric, garments, sugar and ethanol, while inventories and total borrowings were lower than at FY2026 and reported net debt was negative Rs 2,182.10 crore.
The next results will indicate whether the Q2FY27 EBITDA margin of 27.5% can be sustained after the H1FY27 margin of 24.2%. The presentation does not disclose an FY27 revenue, margin, capital-expenditure or cash-flow target, leaving the durability of the Rs 569.42 crore working-capital inflow and the H1FY27 sales trends to subsequent disclosures.