










K.P.R. Mill ethanol sales rise 61% as textile volumes stall
Key highlights
- Ethanol sales value rose 61% year on year to Rs 400 crore in H1FY27, while volume increased 60% to 643.73 lakh litres.
- Sugar sales value increased 21% to Rs 416 crore, leaving it Rs 16 crore ahead of ethanol sales in H1FY27.
- Yarn and fabric volume declined 0.4% to 36,574 metric tonnes, even as sales value rose 17% to Rs 1,125 crore.
- Consolidated EBITDA increased to Rs 956.39 crore from Rs 684.39 crore, and EBITDA margin rose to 24.2% from 19.8%.
powered by IRIS
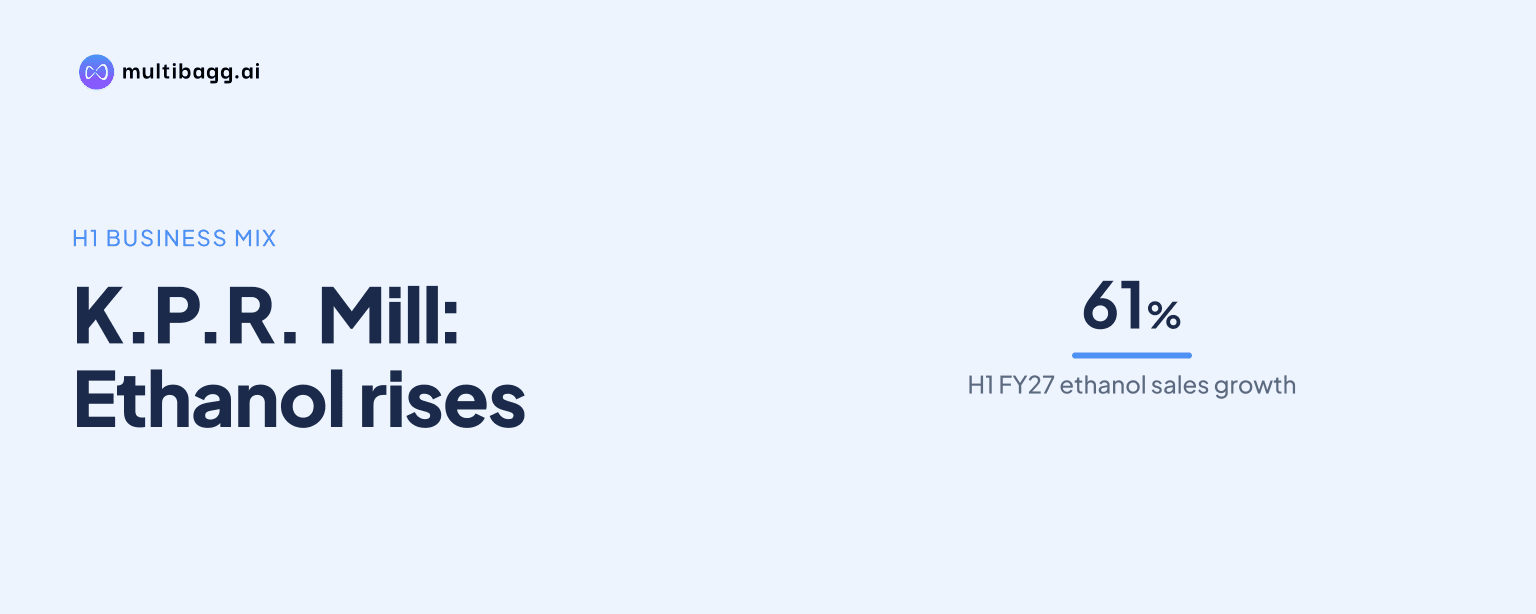
K.P.R. Mill Limited identified ethanol as its fastest-growing disclosed sales business in H1FY27: ethanol sales value rose 61% year on year to Rs 400 crore and volume rose 60% to 643.73 lakh litres. In contrast, yarn and fabric volume declined 0.4% to 36,574 metric tonnes, while garment volume increased 1.2% to 90.30 million garments.
Know K P R Mill inside out
Results, valuation, peers and who's buying, in one view.
What drove K.P.R. Mill’s H1FY27 segment sales growth?
Ethanol drove the largest reported sales-value increase, adding Rs 152 crore in H1FY27. K.P.R. Mill’s ethanol sales value increased from Rs 248 crore in H1FY26 to Rs 400 crore, while volume rose by 240.76 lakh litres from 402.97 lakh litres to 643.73 lakh litres. The reported value increase of 61% was slightly higher than the 60% volume increase.
Sugar was the other non-textile business to show a material increase in both disclosed sales measures. Sugar sales value rose Rs 73 crore, or 21%, from Rs 343 crore in H1FY26 to Rs 416 crore in H1FY27. Sugar volume increased 11,032 metric tonnes, or 12%, to 99,528 metric tonnes from 88,496 metric tonnes.
Ethanol contributed Rs 152 crore of the Rs 225 crore combined increase in sugar and ethanol sales value. Sugar remained the marginally larger business by reported H1FY27 sales value at Rs 416 crore, compared with Rs 400 crore for ethanol. However, the difference narrowed to Rs 16 crore from Rs 95 crore in H1FY26, when sugar recorded Rs 343 crore and ethanol recorded Rs 248 crore.
The disclosed figures show that textile activities remained larger by sales value despite ethanol’s faster growth. Garment sales of Rs 1,707 crore were Rs 1,307 crore higher than ethanol sales in H1FY27, and yarn and fabric sales of Rs 1,125 crore were Rs 725 crore higher. The presentation does not disclose segment-level earnings, margins or capital employed for any of the four sales lines.
How did K.P.R. Mill’s textile volumes change?
K.P.R. Mill’s yarn and fabric sales volume was broadly flat, falling by 155 metric tonnes in H1FY27. Volume declined from 36,729 metric tonnes in H1FY26 to 36,574 metric tonnes, a 0.4% change, even as sales value rose Rs 166 crore, or 17%, to Rs 1,125 crore from Rs 959 crore.
Garment sales volume increased by 1.04 million garments, but the related sales-value gain was limited. K.P.R. Mill reported garment volume of 90.30 million garments in H1FY27, compared with 89.26 million garments a year earlier, while sales value increased Rs 14 crore to Rs 1,707 crore from Rs 1,693 crore. Garments were the largest of the four disclosed sales lines in both half-year comparisons.
The two textile measures cannot be added into one physical-volume total because yarn and fabric are reported in metric tonnes and garments in million garments. Within the disclosed measures, yarn and fabric volume moved down 0.4%, whereas garment volume moved up 1.2%. Those changes were substantially smaller than the 60% increase in ethanol volume and the 12% increase in sugar volume.
The difference between sales-value and volume movements is most apparent in yarn and fabric. Its Rs 166 crore sales-value increase occurred alongside a 155-metric-tonne volume decline, while garments added 1.04 million units but only Rs 14 crore in sales value. The presentation reports the sales and volume data but does not provide pricing, product mix or customer-level detail to explain these movements.
Got a follow-up? Ask IRIS
How did ethanol compare with sugar in H1FY27?
Ethanol grew faster than sugar in H1FY27, although sugar remained Rs 16 crore larger by sales value. Ethanol sales value increased 61% to Rs 400 crore from Rs 248 crore, compared with sugar’s 21% increase to Rs 416 crore from Rs 343 crore. Ethanol’s Rs 152 crore sales-value addition was more than twice sugar’s Rs 73 crore addition.
The two products use different reported volume units, preventing a direct physical-volume comparison. Ethanol volume rose from 402.97 lakh litres to 643.73 lakh litres, while sugar volume increased from 88,496 metric tonnes to 99,528 metric tonnes. Their respective reported gains were 60% and 12%, based on the units used in the presentation.
The comparison also shows a shift in the relative scale of the two disclosed businesses. In H1FY26, sugar sales exceeded ethanol sales by Rs 95 crore, but that gap fell by Rs 79 crore to Rs 16 crore in H1FY27. This calculation measures changes in reported sales value, not profit contribution, because K.P.R. Mill has not provided H1FY27 segment profit data on these pages.
How did segment sales trends align with consolidated results?
K.P.R. Mill’s consolidated revenue from operations increased 14% to Rs 3,875.26 crore in H1FY27. Revenue rose Rs 476.96 crore from Rs 3,398.30 crore in H1FY26, while the disclosed sales-value increases in yarn and fabric, garments, sugar and ethanol totalled Rs 405 crore. The presentation does not provide a reconciliation of the Rs 71.96 crore difference between those reported movements and consolidated revenue growth.
Consolidated earnings before interest, tax, depreciation and amortisation, or EBITDA, rose to Rs 956.39 crore in H1FY27 from Rs 684.39 crore in H1FY26. EBITDA margin increased to 24.2% from 19.8%, and profit after tax increased Rs 172.81 crore to Rs 603.54 crore from Rs 430.73 crore. These are consolidated results and cannot be attributed to ethanol, sugar, garments, or yarn and fabric from the disclosed data.
The half-year balance sheet showed total borrowings of Rs 340.3 crore, down from Rs 596.1 crore at FY2026. K.P.R. Mill reported net borrowings or net debt of negative Rs 2,182.1 crore at H1FY27, compared with negative Rs 834.8 crore at FY2026; fixed deposits with banks and non-banking financial companies were Rs 1,511.2 crore and cash and cash equivalents in mutual fund investments were Rs 1,011.1 crore. These figures provide group financial context but do not identify funding by segment.
Conclusion
K.P.R. Mill’s H1FY27 segment data show that ethanol was the clearest source of sales-volume and sales-value growth, with sales value up 61% to Rs 400 crore and volume up 60% to 643.73 lakh litres. Sugar also expanded, while textile volume trends were limited: yarn and fabric volume fell 0.4% and garment volume increased 1.2%.
The next disclosed issue to watch is the absence of a reconciliation between the Rs 405 crore increase across the four reported sales lines and the Rs 476.96 crore increase in consolidated revenue from operations. The presentation also provides no ethanol-volume target, segment-profit outlook, or explanation of the sales-value and volume differences for yarn and fabric, garments, sugar or ethanol.