










K.P.R. Mill Limited reports zero net debt, Rs 2,522.4 crore cash
Key highlights
- K.P.R. Mill reported zero net debt from FY25 through H1FY27, down from Rs 1,108.3 crore in FY23.
- Cash and cash equivalents rose to Rs 2,522.4 crore in H1FY27 from Rs 1,430.9 crore in FY26.
- H1FY27 EBITDA margin increased to 24.2%, compared with 20.7% in FY26.
- H1FY27 ROCE reached 25.2%, versus 18.4% in FY26, although H1FY27 is a partial-year period.
powered by IRIS
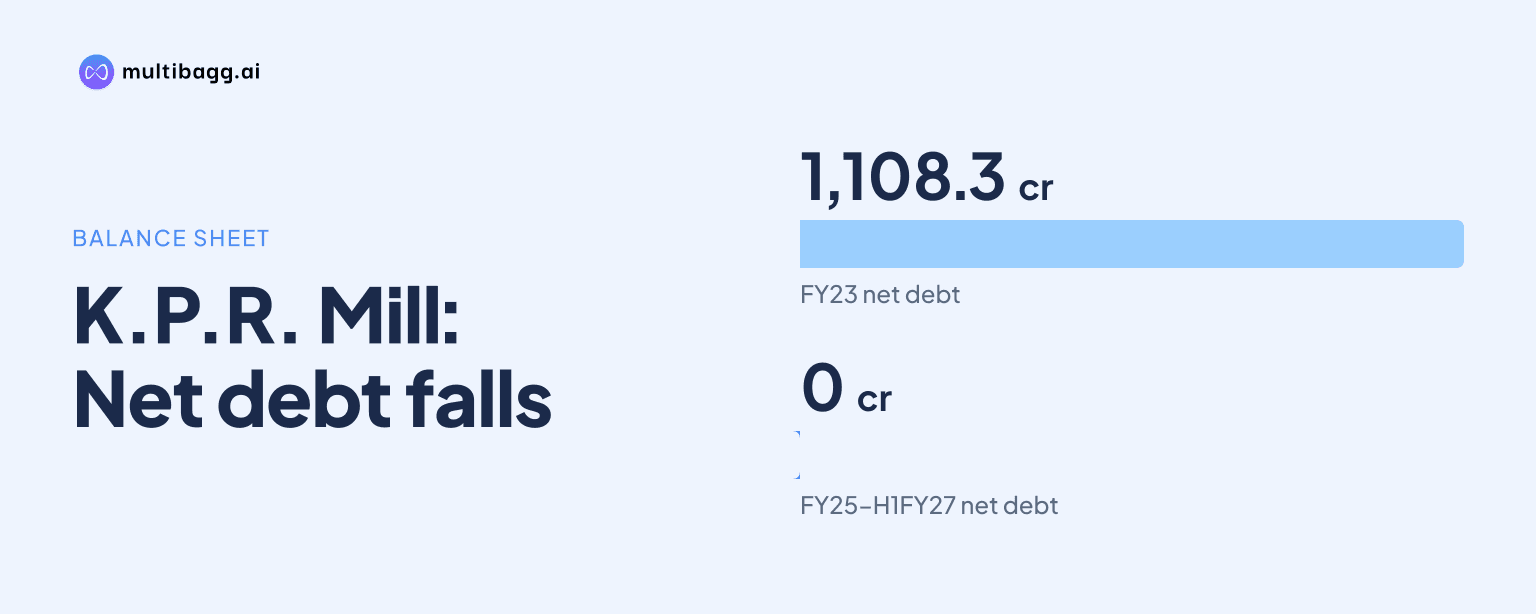
K.P.R. Mill reported net debt of Rs 0.0 crore from FY25 through H1FY27, after Rs 1,108.3 crore in FY23, while cash and cash equivalents reached Rs 2,522.4 crore in H1FY27. EBITDA margin rose to 24.2% and return on capital employed reached 25.2% in H1FY27.
Know K P R Mill inside out
Results, valuation, peers and who's buying, in one view.
How did K.P.R. Mill move from net debt to zero reported net debt?
K.P.R. Mill reduced reported net debt from Rs 1,108.3 crore in FY23 to Rs 947.4 crore in FY24, followed by Rs 0.0 crore in FY25, FY26 and H1FY27. Its net-debt-to-equity ratio moved in the same direction, falling from 0.30 in FY23 to 0.22 in FY24 and 0.00 from FY25. FY23 total borrowings were Rs 1,348.1 crore and equity was Rs 3,706.7 crore.
The detailed financial-position schedule gives additional context for FY25 and FY26. It records net borrowings of negative Rs 114.8 crore in FY25 and negative Rs 834.8 crore in FY26, indicating that cash and specified deposits exceeded total borrowings. The separate financial-highlights chart instead reports net debt of Rs 0.0 crore for both years, so K.P.R. Mill presented those periods as having zero net debt.
What changed in K.P.R. Mill's funding and liquidity?
K.P.R. Mill's shift reflected lower long-term borrowings and a larger cash-and-deposit balance. Total borrowings fell from Rs 1,348.1 crore in FY23 to Rs 596.1 crore in FY26, although short-term borrowings increased to Rs 570.3 crore in FY26 from Rs 412.1 crore in FY25. Long-term borrowings declined from Rs 448.5 crore in FY23 to Rs 295.2 crore in FY24, Rs 53.8 crore in FY25 and Rs 25.8 crore in FY26.
Cash and cash equivalents increased by Rs 2,282.6 crore between FY23 and H1FY27, rising from Rs 239.8 crore to Rs 2,522.4 crore. For FY26, the detailed schedule lists Rs 1,303.4 crore in fixed deposits with banks and non-banking financial companies, plus Rs 127.5 crore in cash and cash equivalents invested in mutual funds. Together, these figures match the Rs 1,430.9 crore shown in the financial-highlights chart.
The H1FY27 chart provides the Rs 2,522.4 crore total but not a split between deposits, cash and mutual-fund investments. Equity rose from Rs 3,706.7 crore in FY23 to Rs 5,697.6 crore in FY26, while capital employed increased from Rs 4,932.3 crore to Rs 5,015.2 crore. Investment in fixed assets peaked at Rs 2,546.1 crore in FY24 before standing at Rs 2,465.1 crore in FY26.
Got a follow-up? Ask IRIS
Have K.P.R. Mill's operating returns improved alongside the balance-sheet change?
Yes. K.P.R. Mill reported an EBITDA margin of 24.2% in H1FY27, above 20.7% in FY26, 20.4% in FY25 and 21.3% in FY24. EBITDA means earnings before interest, tax, depreciation and amortisation. The H1FY27 margin was also above the 21.4% reported in FY23.
Return on capital employed, or ROCE, reached 25.2% in H1FY27, compared with 18.4% in FY26. The measure had declined from 22.6% in FY23 to 19.8% in FY24, before recording 19.9% in FY25. H1FY27 is a partial-year period, so its 25.2% ROCE is not directly comparable with the full-year figures, although it is the highest result in the disclosed series.
FY26 revenue from operations was Rs 6,650.4 crore, compared with Rs 6,387.9 crore in FY25 and Rs 6,185.9 crore in FY23. EBITDA increased to Rs 1,401.2 crore in FY26 from Rs 1,320.4 crore in FY25, while profit after tax rose to Rs 866.5 crore from Rs 815.1 crore. Finance cost was Rs 51.6 crore in FY26, lower than Rs 78.9 crore in FY23.
Which businesses provide H1FY27 context for K.P.R. Mill's financial position?
Garments, sugar and ethanol all recorded higher H1FY27 sales values, although the presentation does not assign cash generation by segment. Garment sales value increased to Rs 1,707 crore from Rs 1,693 crore in H1FY26. Garment sales volume rose by 1.04 million garments to 90.30 million garments over the same comparison.
Sugar sales value rose to Rs 416 crore in H1FY27 from Rs 343 crore in H1FY26, while volume increased to 99,528 metric tonnes from 88,496 metric tonnes. Ethanol sales value increased to Rs 400 crore from Rs 248 crore. Ethanol volume rose to 643.73 lakh litres from 402.97 lakh litres.
K.P.R. Mill's export mix also changed. Europe represented 65.0% of exports in H1FY27, compared with 63.1% in FY26 and 60.8% in FY23. North America's share fell to 13.3% from 15.7% in FY26 and 19.5% in FY23, while Asia's share rose to 5.2% from 4.6%. The presentation does not quantify export revenue or link geographic mix to the H1FY27 cash balance.
Conclusion
K.P.R. Mill's reported figures show a substantial funding change between FY23 and H1FY27. Reported net debt moved from Rs 1,108.3 crore to Rs 0.0 crore, and cash and cash equivalents rose from Rs 239.8 crore to Rs 2,522.4 crore. H1FY27 EBITDA margin of 24.2% and ROCE of 25.2% were also above the FY26 readings of 20.7% and 18.4%, respectively.
The next disclosure to watch is the composition of the Rs 2,522.4 crore H1FY27 cash-and-cash-equivalents balance and the related borrowing amount. K.P.R. Mill does not provide an H1FY27 deposit, cash and mutual-fund break-up, while its net-debt chart reports Rs 0.0 crore despite the detailed FY25 and FY26 schedules showing negative net borrowings.