










KSB revenue and profit grew at 17% and 22% CAGR by 2025
Key highlights
- KSB reported revenue from operations of Rs 2,695.7 crore in 2025, up from Rs 1,208.1 crore in 2020.
- KSB's profit after tax rose from Rs 97.3 crore in 2020 to Rs 264.5 crore in 2025, a stated 22% CAGR.
- KSB reported EBITDA of Rs 387.3 crore in 2025, compared with Rs 177.6 crore in 2020.
- KSB's 2025 ROCE was 22.80%, while its reported dividend percentage was 220%.
powered by IRIS
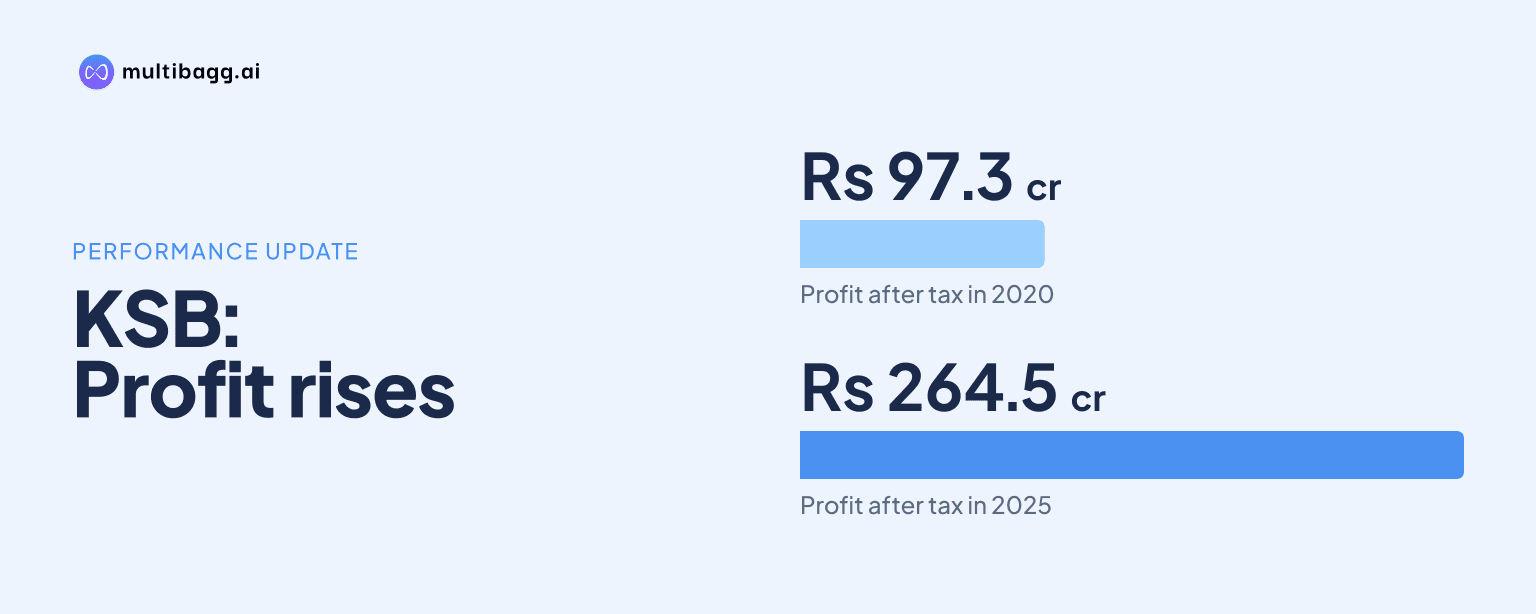
KSB Limited reported a 17% compound annual growth rate (CAGR) in revenue from operations and a 22% CAGR in profit after tax between 2020 and 2025, reaching Rs 2,695.7 crore and Rs 264.5 crore, respectively, in 2025. Its 17 November 2026 Investor Meet presentation also shows growth in EBITDA, net worth, earnings per share and dividend percentage over the period.
Know KSB inside out
Results, valuation, peers and who's buying, in one view.
How did KSB's revenue and profit change from 2020 to 2025?
KSB increased revenue from operations by Rs 1,487.6 crore, from Rs 1,208.1 crore in 2020 to Rs 2,695.7 crore in 2025, representing the presentation's stated 17% CAGR. Revenue increased in each full year shown: Rs 1,497.3 crore in 2021, Rs 1,822 crore in 2022, Rs 2,247.2 crore in 2023 and Rs 2,533.1 crore in 2024.
KSB's profit after tax rose by Rs 167.2 crore over the same period, from Rs 97.3 crore in 2020 to Rs 264.5 crore in 2025. The stated 22% profit CAGR was higher than the 17% revenue CAGR. Profit after tax was Rs 146.6 crore in 2021, Rs 179.3 crore in 2022, Rs 204.6 crore in 2023 and Rs 240.9 crore in 2024.
KSB reported revenue from operations of Rs 2,064.7 crore and profit after tax of Rs 154.1 crore for Sep-26 YTD, or year to date. These are partial-period amounts rather than a full-year result. The presentation does not provide Sep-25 YTD figures, so it does not establish a like-for-like year-on-year comparison for the Sep-26 YTD numbers.
Did KSB's EBITDA rise alongside revenue and profit?
KSB's earnings before interest, taxes, depreciation and amortisation, or EBITDA, increased from Rs 177.6 crore in 2020 to Rs 387.3 crore in 2025, a gain of Rs 209.7 crore. The presentation assigns a 17% CAGR to EBITDA, the same stated growth rate as revenue from operations over the 2020-2025 period.
KSB's EBITDA was Rs 223.5 crore in 2021, Rs 269.5 crore in 2022, Rs 309.6 crore in 2023 and Rs 350.3 crore in 2024. EBITDA increased by Rs 37 crore from 2024 to 2025, while revenue rose by Rs 162.6 crore between those two full years. The financial snapshot does not provide a breakdown of EBITDA by product, market area or cost category.
KSB reported Sep-26 YTD EBITDA of Rs 235.2 crore, alongside revenue of Rs 2,064.7 crore and profit after tax of Rs 154.1 crore. The presentation places all three figures in its current partial-period snapshot. It does not show a Sep-25 YTD EBITDA figure or provide full-year 2026 revenue, EBITDA or profit guidance.
Got a follow-up? Ask IRIS
How did KSB's net worth and EPS evolve?
KSB's net worth increased from Rs 846.4 crore in 2020 to Rs 1,612.8 crore in 2025, an expansion of Rs 766.4 crore. The reported sequence rose each year, reaching Rs 964.1 crore in 2021, Rs 1,093.1 crore in 2022, Rs 1,247.8 crore in 2023 and Rs 1,425.1 crore in 2024.
KSB reported net worth of Rs 1,688 crore in Sep-26 YTD, which was Rs 75.2 crore above the 2025 figure. The presentation does not state whether the increase reflects earnings, reserves, capital transactions or another balance-sheet movement. It also does not set a net-worth target or disclose a capital-allocation plan on the financial-snapshot pages.
KSB's adjusted post-split earnings per share, or EPS, rose from Rs 5.60 in 2020 to Rs 15.20 in 2025. The annual EPS figures were Rs 8.40 in 2021, Rs 10.30 in 2022, Rs 11.80 in 2023 and Rs 13.80 in 2024, while Sep-26 YTD EPS was Rs 8.85.
The disclosed figures show that 2025 recorded KSB's highest full-year net worth and adjusted post-split EPS in the displayed series. The presentation labels the EPS measure as adjusted post split, rather than giving an unadjusted historical EPS series. It does not include an EPS forecast for 2026 or a Sep-25 YTD EPS comparator.
What changed in KSB's ROCE and dividend percentage?
KSB's return on capital employed, or ROCE, rose from 19.11% in 2020 to 22.80% in 2025. ROCE was 21.51% in 2021, 22.97% in 2022, 23.20% in 2023 and 23.42% in 2024. Accordingly, the 2025 figure was 3.69 percentage points above 2020 but 0.62 percentage points below 2024.
KSB separately states that ROCE excluding the impact of the labour code was 24.0%. The presentation does not attach a separate period to that note or quantify the labour-code impact in rupees. No Sep-26 YTD ROCE is displayed, preventing a comparison between the 2025 full-year level and the current partial period.
KSB's reported dividend percentage rose each year from 85% in 2020 to 220% in 2025. The intermediate levels were 125% in 2021, 150% in 2022, 175% in 2023 and 200% in 2024. The 2025 dividend percentage was 20 percentage points higher than in 2024 and 135 percentage points above 2020.
The presentation reports a dividend percentage but does not disclose dividend per share, a payout ratio or a dividend-policy target. As a result, the reported 220% figure can be compared with prior annual percentages, but the source does not support a calculation of the cash distribution or its relationship to 2025 profit after tax of Rs 264.5 crore.
Conclusion
KSB's 2020-2025 financial snapshot shows that revenue growth was accompanied by rising reported profit, EBITDA, net worth, EPS and dividend percentage. Revenue rose from Rs 1,208.1 crore to Rs 2,695.7 crore and profit after tax grew from Rs 97.3 crore to Rs 264.5 crore, while ROCE moved from 19.11% to 22.80% despite declining from its 2024 level of 23.42%.
The next disclosed result to watch is the full-year outcome from Sep-26 YTD revenue of Rs 2,064.7 crore, EBITDA of Rs 235.2 crore and profit after tax of Rs 154.1 crore. KSB gives no 2026 revenue, profit, EPS, ROCE or dividend target in this presentation, and no Sep-25 YTD comparison is supplied to assess current-period growth.