










KSH International cuts debt-equity to 0.38 in Q2 FY27
Key highlights
- KSH International reported debt-equity of 0.38 in Q2 FY27, compared with 1.38 in Q2 FY26.
- Net average working-capital days fell to 52 in Q2 FY27 from 70 days a year earlier.
- H1 FY27 revenue reached Rs 2,483.9 crore, up 95.45% year on year.
- KSH International plans investment of up to Rs 185 crore for Supa Phase 3, targeted for Q1 FY29.
powered by IRIS
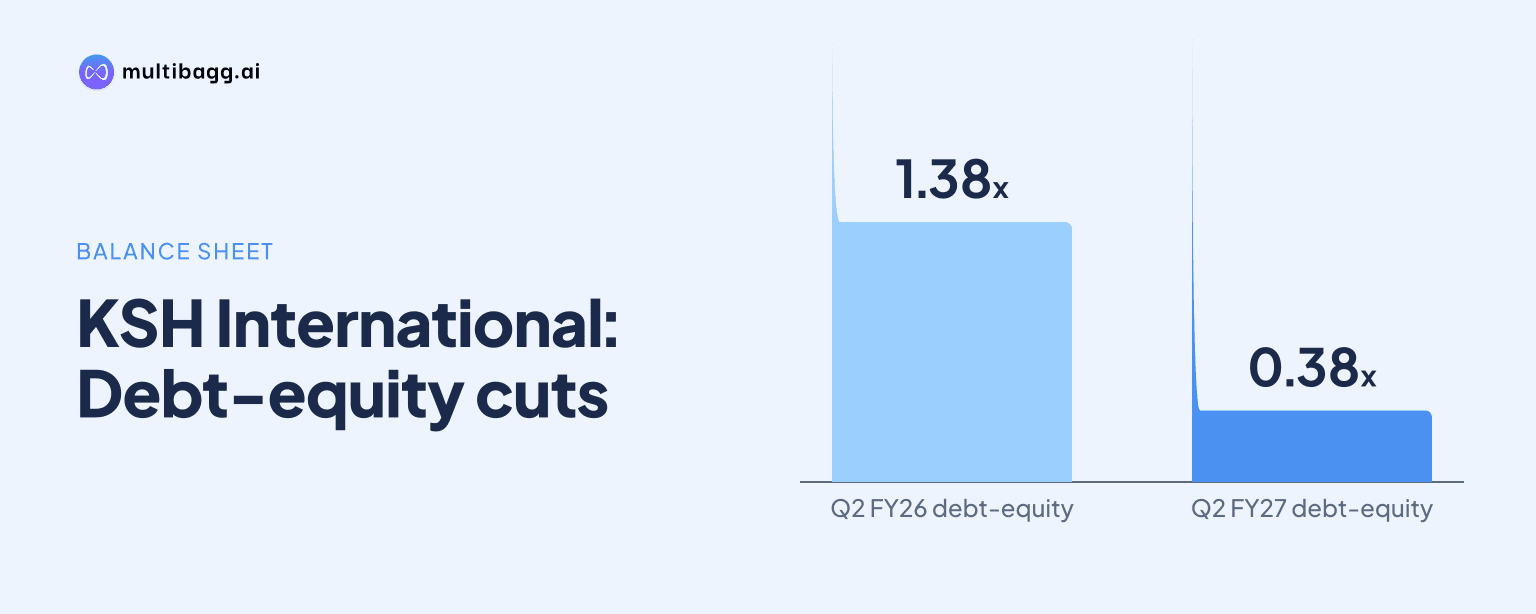
KSH International Limited reported debt-equity of 0.38 and net average working-capital days of 52 in Q2 FY27, compared with 1.38 and 70 days in Q2 FY26. The company said working-capital efficiency contributed to positive operating cash flow in H1 FY27, while the Q2 summary put total debt at Rs 341.3 crore.
Know KSH International inside out
Results, valuation, peers and who's buying, in one view.
Why did KSH International's debt-equity ratio fall to 0.38?
KSH International reported debt-equity of 0.38 in Q2 FY27, down from 1.38 in Q2 FY26. Its management summary said debt consisted mostly of growth-driven working-capital loans and that outstanding debt reduced during the second quarter. The presentation does not provide a quarterly bridge identifying the precise components behind the year-on-year change in the ratio.
The historical financial highlights show debt-equity at 0.39 in FY26 and 0.38 in H1 FY27. That indicates a 0.01-point movement between the FY26 and H1 FY27 reported periods, compared with the 1.00-point decline in the Q2 year-on-year management-summary comparison. The H1 FY27 balance sheet shows total equity of Rs 898.9 crore, against Rs 808.1 crore at FY26.
Total borrowings in the H1 FY27 balance sheet were Rs 341.3 crore, comprising Rs 318.4 crore of current borrowings and Rs 22.9 crore of non-current borrowings. At FY26, borrowings totalled Rs 316.2 crore, including Rs 290.2 crore of current and Rs 26 crore of non-current borrowings. The presentation therefore separately reports a reduction in outstanding debt during Q2 and a higher H1 closing borrowing balance than at FY26.
What changed in KSH International's working-capital balances?
KSH International's net average working-capital days fell to 52 in Q2 FY27 from 70 in Q2 FY26, despite larger reported inventory, receivable and payable balances at H1 FY27. Management said its focus on working-capital efficiency, together with operating growth, contributed to positive operating cash flow in H1 FY27. It did not disclose the cash-flow amount or a calculation of the 52-day metric.
Inventories rose to Rs 542 crore at H1 FY27 from Rs 424.9 crore at FY26, while trade receivables increased to Rs 586.4 crore from Rs 332.7 crore. Trade payables grew to Rs 418.3 crore from Rs 123.5 crore over the same period. The larger payable balance is relevant to the stated reduction in net average working-capital days, but the presentation does not quantify each balance's contribution.
Cash and cash equivalents declined to Rs 41.6 crore at H1 FY27 from Rs 72.1 crore at FY26, while total current assets rose to Rs 1,244.9 crore from Rs 889.3 crore. Other current assets increased to Rs 61.1 crore from Rs 46.2 crore. These period-end balances cannot by themselves establish the company's cash conversion cycle, which management reports as net average working-capital days.
How did operating growth coincide with KSH International's cash-flow statement?
KSH International linked its positive H1 FY27 operating cash flow to operating growth and working-capital efficiency, while revenue from operations rose 95.45% year on year to Rs 2,483.9 crore. Earnings before interest, tax, depreciation and amortisation, or EBITDA, increased 89.93% to Rs 164.1 crore, and profit after tax rose 72.51% to Rs 90.2 crore. The company did not publish operating cash flow in rupees in the presentation.
Sales volume increased 27.83% to 16,812 metric tonnes in H1 FY27 from 13,152 metric tonnes in H1 FY26. EBITDA per tonne rose 48.58% to Rs 97,600 from Rs 65,687, a faster increase than volume. This comparison shows that reported revenue and EBITDA growth exceeded volume growth during the half year.
In Q2 FY27, revenue from operations was Rs 1,319.7 crore, up 85.33% from Rs 712.1 crore in Q2 FY26 and 13.35% above Rs 1,164.2 crore in Q1 FY27. Q2 EBITDA margin was 6.80%, compared with 6.47% a year earlier and 6.39% in Q1 FY27. The company reported 76% utilisation of available capacity of 57,845 metric tonnes in Q2 FY27.
Got a follow-up? Ask IRIS
How did margins and finance costs move in H1 FY27?
KSH International's H1 FY27 profit after tax margin was 3.63%, compared with 4.11% in H1 FY26, even as profit after tax increased by Rs 37.9 crore to Rs 90.2 crore. Gross profit margin declined to 10.17% from 11.07%, while EBITDA margin moved to 6.61% from 6.80%. The half-year figures therefore show higher absolute profit alongside lower gross, EBITDA and net margins year on year.
Finance costs increased to Rs 39.5 crore in H1 FY27 from Rs 16.6 crore in H1 FY26. Depreciation and amortisation rose to Rs 17.5 crore from Rs 7.2 crore, while property, plant and equipment increased to Rs 404.5 crore at H1 FY27 from Rs 307.5 crore at FY26. In Q2 FY27, finance costs were Rs 22.3 crore, versus Rs 9.3 crore in Q2 FY26.
Profit before tax margin was 4.86% in H1 FY27, down from 5.51% a year earlier, although profit before tax increased to Rs 120.8 crore from Rs 70.1 crore. The presentation also reports H1 FY27 diluted earnings per share of Rs 13.29, compared with Rs 9.20 in H1 FY26. These measures provide the reported earnings context for management's statement on debt and operating cash flow.
What funding requirement does KSH International's Supa plan disclose?
KSH International has approved a Phase 3 brownfield expansion and land acquisition at Supa, Ahilyanagar, with planned capital investment of up to Rs 185 crore. Management expects the project to be completed in Q1 FY29 and says specialized-wire capacity would increase 22% to 72,200 metric tonnes, from 59,045 metric tonnes after Phase II. The presentation does not state how the investment will be funded.
The company said it had completed installation of 96% of its planned 59,045-metric-tonne capacity six months ahead of schedule. The Q2 FY27 management summary lists available capacity of 57,845 metric tonnes and utilisation of 76%. Management cited supply continuity for original equipment manufacturer customers, a greater specialized-wire mix and export penetration as the strategic rationale for the next phase.
KSH International reported specialized-wire mix of 74% in Q2 FY27, compared with 77% in Q2 FY26. Specialized revenue grew 87% year on year and export revenue grew 108%, while the company also reported trial high-voltage direct current export orders. These disclosures identify the operating areas management expects the Supa capacity to address, rather than a target for debt, cash flow or working-capital days.
Conclusion
KSH International combined a reported 52-day net average working-capital cycle and 0.38 debt-equity ratio in Q2 FY27 with 95.45% H1 revenue growth. Inventory, receivables and trade payables all increased from FY26 to H1 FY27, while management reported positive H1 operating cash flow and attributed it partly to working-capital efficiency.
The next disclosed milestone is Phase 3 at Supa, targeted for Q1 FY29 with investment of up to Rs 185 crore and planned specialized-wire capacity of 72,200 metric tonnes. The presentation leaves funding unspecified, making subsequent disclosures on borrowing, capacity utilisation, working-capital days and the expansion timetable relevant to watch.