










LIC Housing Finance Limited's retail book is 97% in H1FY27
Key highlights
- LIC HFL's outstanding portfolio rose 5% year on year to Rs 3,26,173 crore at 30 September 2026.
- Retail loans totalled Rs 3,16,433 crore, while project loans grew 12% year on year to Rs 9,740 crore.
- LIC HFL's annualised yield on advances fell to 9.04% in H1FY27 from 9.40%, while its cost of funds declined to 7.29% from 7.42%.
- Retail disbursements increased 10% to Rs 31,704 crore in H1FY27, while project-finance disbursements rose 169% to Rs 1,436 crore.
powered by IRIS
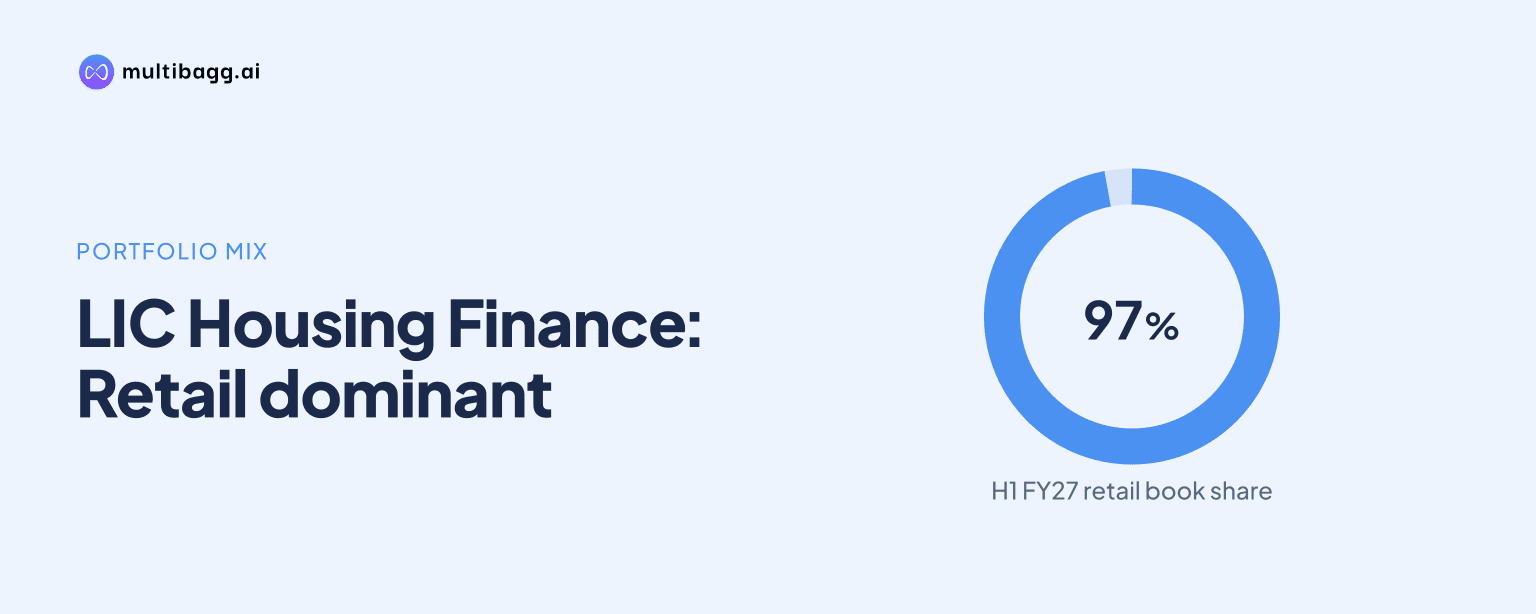
LIC Housing Finance Limited (LIC HFL) reported a Rs 3,26,173 crore outstanding portfolio at 30 September 2026, with retail loans representing 97.0%. It also said 99% of individual-loan balances were pure floating-rate in the first half of FY27 (H1FY27), while the loan-to-value ratio on incremental sanctions was 48%.
Know LIC Housing Finance inside out
Results, valuation, peers and who's buying, in one view.
How retail-focused is LIC HFL's loan book?
LIC HFL's outstanding portfolio was 97.0% retail at 30 September 2026, comprising Rs 3,16,433 crore of retail loans and Rs 9,740 crore of project loans. Project lending accounted for the remaining 3.0% of the Rs 3,26,173 crore book, and the disclosed split measures outstanding balances rather than only H1FY27 originations.
The retail share was 97.2% at 30 September 2025, compared with 97.0% a year later, while the project-loan share increased from 2.8% to 3.0%. Total outstanding loans rose by Rs 14,357 crore over the year, with retail balances increasing by Rs 13,349 crore and project balances by Rs 1,008 crore.
LIC HFL reported 4% year-on-year growth in its outstanding retail portfolio and 12% growth in project loans at the end of the second quarter of FY27. The faster percentage growth in project loans, from a smaller balance, coincided with the 0.2-percentage-point decline in retail's portfolio share.
How much of LIC HFL's individual-loan portfolio is floating-rate?
LIC HFL reported that pure floating-rate loans accounted for 99% of its individual-loan outstanding portfolio in financial year 2025 (FY25), financial year 2026 (FY26) and H1FY27. The presentation therefore shows no change in this proportion across the three disclosed periods.
The 99% measure applies specifically to individual loans, whereas the overall portfolio also included Rs 9,740 crore of project loans at 30 September 2026. LIC HFL did not disclose a fixed-rate balance, benchmark linkage, repricing timetable or the rate mix of its project-loan portfolio.
The individual-loan rate structure was reported alongside lower half-year pricing measures. LIC HFL's annualised yield on advances was 9.04% in H1FY27, versus 9.40% in H1FY26, while its weighted average cost of funds declined to 7.29% from 7.42%. Its reported spread was 1.75%, down from 1.98%, and net interest margin was 2.57%, compared with 2.65%.
Got a follow-up? Ask IRIS
What loan-to-value ratio does LIC HFL report on new sanctions?
LIC HFL reported a 48% loan-to-value ratio, or LTV, on incremental sanctions in FY26 and H1FY27, down from 50% in FY25. LTV compares the sanctioned loan amount with the value of the underlying property, and this disclosure concerns new sanctions rather than the outstanding portfolio.
The two-percentage-point reduction from FY25 was maintained in H1FY27. LIC HFL did not provide a breakdown of the 48% LTV by borrower category, city, property type or origination channel, so the presentation does not identify the contributors to the change.
LIC HFL's instalment-to-net-income ratio on incremental sanctions was 42% in FY26 and H1FY27, compared with 43% in FY25. This ratio measures instalments against a borrower's net income, meaning both disclosed new-sanction ratios declined in FY26 and remained unchanged through the first half of FY27.
Where do LIC HFL's new loans originate?
LIC HFL's origination mix was led by home loan agents, at 51.8%, followed by direct sales agents at 19.5% and corporate agents at 17.4%. Direct sourcing represented 8.8%, customer relations associates 2.3%, and direct marketing executives 0.2%, bringing the six disclosed channels to 100.0%.
LIC HFL reported that 85% of customers by number were salaried and 15% were self-employed. Its top eight cities had 84 offices and were shown with a 43% share, while other locations had 213 offices and a 57% share; the presentation does not specify a disbursement amount or loan count for those city groups.
Retail disbursements rose 10% to Rs 31,704 crore in H1FY27 from Rs 28,895 crore in H1FY26. Project-finance disbursements increased 169% to Rs 1,436 crore from Rs 534 crore, taking total disbursements to Rs 33,140 crore, up 13% from Rs 29,429 crore. LIC HFL also reported Rs 1,794 crore of online loan approvals in H1FY27, which are distinct from disbursements.
Conclusion
LIC HFL's disclosures show that its portfolio remained overwhelmingly retail at 30 September 2026, even as project loans grew faster year on year. The individual-loan book was 99% pure floating-rate, while incremental LTV and instalment-to-net-income ratios were 48% and 42%, respectively, both unchanged from FY26.
The next disclosures will show whether project-loan growth continues to outpace retail growth and affects the 97.0% retail share. Another unresolved measure is prepayment: LIC HFL reported 11.9% in H1FY27, after 12.0% in FY26 and 9.4% in FY25.