










LIC Housing Finance Ltd Q2 profit rises on impairment gain
Key highlights
- LIC HFL’s Q2 FY27 net profit rose 11% to Rs. 1,508.78 crore from Rs. 1,353.87 crore a year earlier.
- The impairment line swung to a Rs. 92.57 crore gain in Q2 FY27 from a Rs. 71.99 crore charge in Q2 FY26.
- Net interest income increased 2% to Rs. 2,087.86 crore, while net interest margin declined 4 basis points to 2.58%.
- The loan portfolio grew 5% year on year to Rs. 3,26,173 crore at 30 September 2026, with project-finance disbursements rising 49% in Q2 FY27.
powered by IRIS
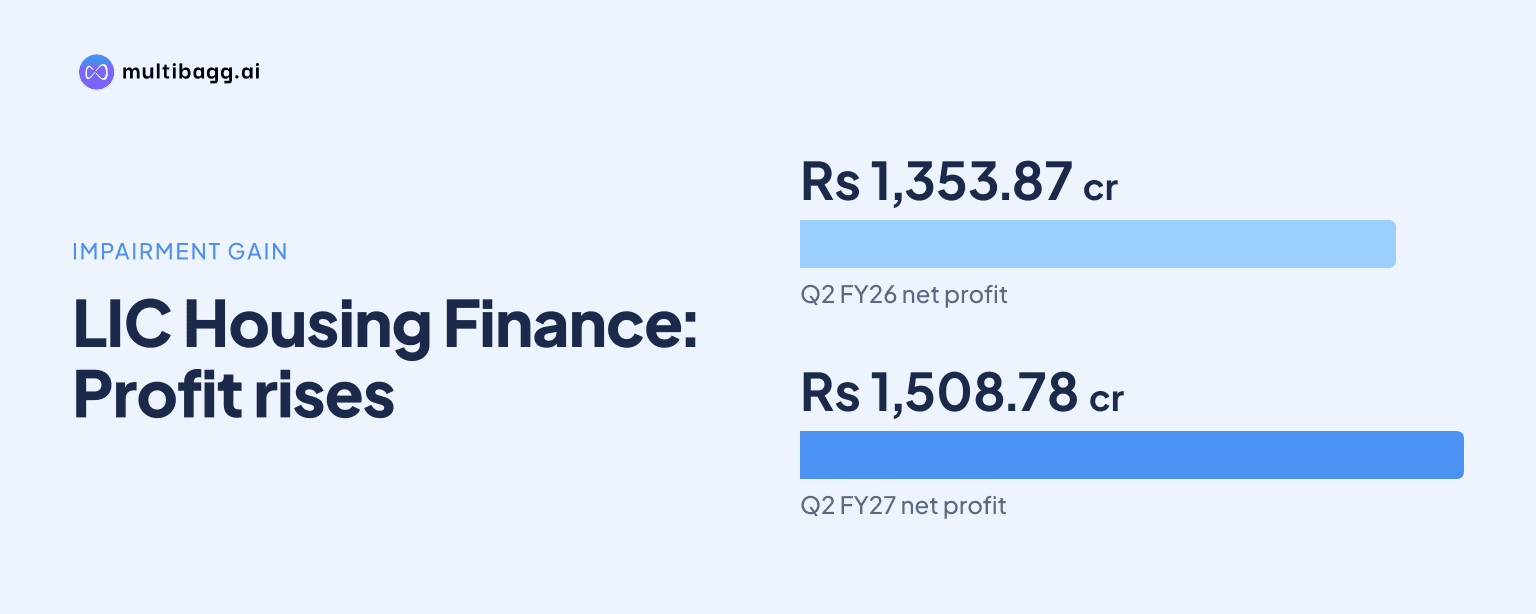
LIC Housing Finance Ltd reported Q2 FY27 net profit of Rs. 1,508.78 crore, up 11% from Rs. 1,353.87 crore in Q2 FY26. LIC HFL recorded a Rs. 92.57 crore impairment gain, compared with a Rs. 71.99 crore charge a year earlier, while net interest income increased 2% to Rs. 2,087.86 crore.
Know LIC Housing Finance inside out
Results, valuation, peers and who's buying, in one view.
What drove LIC HFL's Q2 FY27 profit increase?
LIC HFL's Q2 FY27 profit increase was principally supported by the movement from an impairment charge to an impairment gain. Profit before tax rose 13% to Rs. 1,918.55 crore from Rs. 1,704.71 crore, while tax expense increased 17% to Rs. 409.77 crore from Rs. 350.84 crore, resulting in an 11% increase in net profit.
Revenue from operations rose 1% to Rs. 7,175.08 crore in Q2 FY27, while finance cost also increased 1% to Rs. 5,024.15 crore. Net interest income, or NII, therefore rose by Rs. 50.49 crore to Rs. 2,087.86 crore, a smaller absolute movement than the Rs. 164.56 crore swing in the impairment line.
The impairment gain was recorded within impairment on financial instruments and net loss on derecognition of financial instruments. The line showed a Rs. 92.57 crore gain in Q2 FY27 rather than the Rs. 71.99 crore charge in Q2 FY26, while H1 FY27 included a Rs. 256.80 crore gain against a Rs. 193.66 crore charge in H1 FY26.
How did LIC HFL's margin and funding costs change?
LIC HFL's Q2 FY27 net interest margin declined by 4 basis points to 2.58% from 2.62% in Q2 FY26. A basis point equals one-hundredth of a percentage point, and the lower margin occurred despite the 2% increase in quarterly NII to Rs. 2,087.86 crore.
For H1 FY27, net interest margin was 2.57%, compared with 2.65% in H1 FY26. The weighted average cost of funds declined to 7.29% from 7.42%, but the annualised yield on advances fell to 9.04% from 9.40%, reducing the disclosed spread to 1.75% from 1.98%.
LIC HFL reported an incremental cost of funds of 6.91% during Q2 FY27, below the 7.29% weighted average cost of its outstanding funding as at 30 September 2026. Outstanding borrowings were Rs. 2,78,780 crore, with non-convertible debentures accounting for 45% and bank borrowings accounting for 38%.
The disclosed funding mix also included National Housing Bank borrowings at 9%, other sources at 5% and deposits at 3% of outstanding borrowings. Commercial paper carried the lowest listed weighted average cost at 6.69%, while non-convertible debentures carried the highest at 7.71% as at 30 September 2026.
Got a follow-up? Ask IRIS
How fast did LIC HFL's portfolio and disbursements grow?
LIC HFL's outstanding loan portfolio grew 5% year on year to Rs. 3,26,173 crore at 30 September 2026, while Q2 FY27 disbursements rose 11% to Rs. 18,127 crore. Retail loans represented 97.0% of the outstanding portfolio, and project loans represented 3.0%.
Retail outstanding loans increased 4% to Rs. 3,16,433 crore from Rs. 3,03,084 crore a year earlier. Project loans grew 12% to Rs. 9,740 crore from Rs. 8,732 crore, increasing their share of the book from 2.8% at 30 September 2025 to 3.0% a year later.
Retail disbursements rose 10% to Rs. 17,563 crore in Q2 FY27 from Rs. 15,935 crore. Project-finance disbursements increased 49% to Rs. 564 crore from Rs. 378 crore, although retail supplied the bulk of the Rs. 18,127 crore total quarterly disbursement.
The first-half figures showed faster growth in project finance than retail lending. H1 FY27 project-finance disbursements were Rs. 1,436 crore, up 169% from Rs. 534 crore in H1 FY26, while retail disbursements increased 10% to Rs. 31,704 crore and total disbursements increased 13% to Rs. 33,140 crore.
What do LIC HFL's disclosed credit measures show?
LIC HFL reported Stage 3 exposure at default, or EAD, of 2.05% at 30 September 2026, down from 2.51% at 30 September 2025. The 46-basis-point reduction coincided with total expected credit loss, or ECL, provisions declining to Rs. 4,292 crore from Rs. 5,074 crore.
The presentation defines total provisions as ECL provisions across Stage 1, Stage 2 and Stage 3. Its five-year data show Stage 3 EAD declining from 4.64% in 2022 to 2.16% in 2026, while total provisions declined from Rs. 7,230 crore in 2023 to Rs. 4,569 crore in 2026.
Individual-loan portfolio characteristics were broadly unchanged in H1 FY27. Pure floating-rate loans accounted for 99% of the outstanding portfolio, while the loan-to-value ratio on incremental sanctions was 48%, unchanged from FY26 and lower than 50% in FY25.
The instalment-to-net-income ratio on incremental sanctions was 42% in H1 FY27, the same as FY26 and below 43% in FY25. Prepayments measured as lump-sum prepayments over the opening book were 11.9% in H1 FY27, compared with 12.0% in FY26.
Conclusion
LIC HFL's Q2 FY27 performance combined modest growth in revenue and NII with a substantial change in the impairment line. Revenue from operations increased 1%, NII increased 2%, and the outstanding portfolio increased 5%, while the shift from a Rs. 71.99 crore charge to a Rs. 92.57 crore gain contributed to net profit rising 11% to Rs. 1,508.78 crore.
The next reported periods will show whether the H1 FY27 decline in yield on advances to 9.04% continues to outpace the decline in funding cost to 7.29%, affecting the 2.57% first-half margin. They will also show whether project finance maintains its faster growth rate after project disbursements rose 169% in H1 FY27 and project loans reached 3.0% of the portfolio at 30 September 2026.