










LIC HFL Stage 3 exposure falls to 2.05%, coverage drops
Key highlights
- LIC HFL’s Stage 3 exposure at default fell to 2.05% in September 2026 from 2.51% a year earlier.
- LIC HFL’s outstanding portfolio grew 5% year on year to Rs 3,26,173 crore at September 30, 2026.
- Stage 3 provision coverage declined to 49% from 53%, while Stage 3 ECL provisions fell by Rs 874.63 crore to Rs 3,281.86 crore.
- LIC HFL’s Q2 FY27 net profit rose 11% year on year to Rs 1,508.78 crore, while net interest margin declined to 2.57% in H1 FY27 from 2.65%.
powered by IRIS
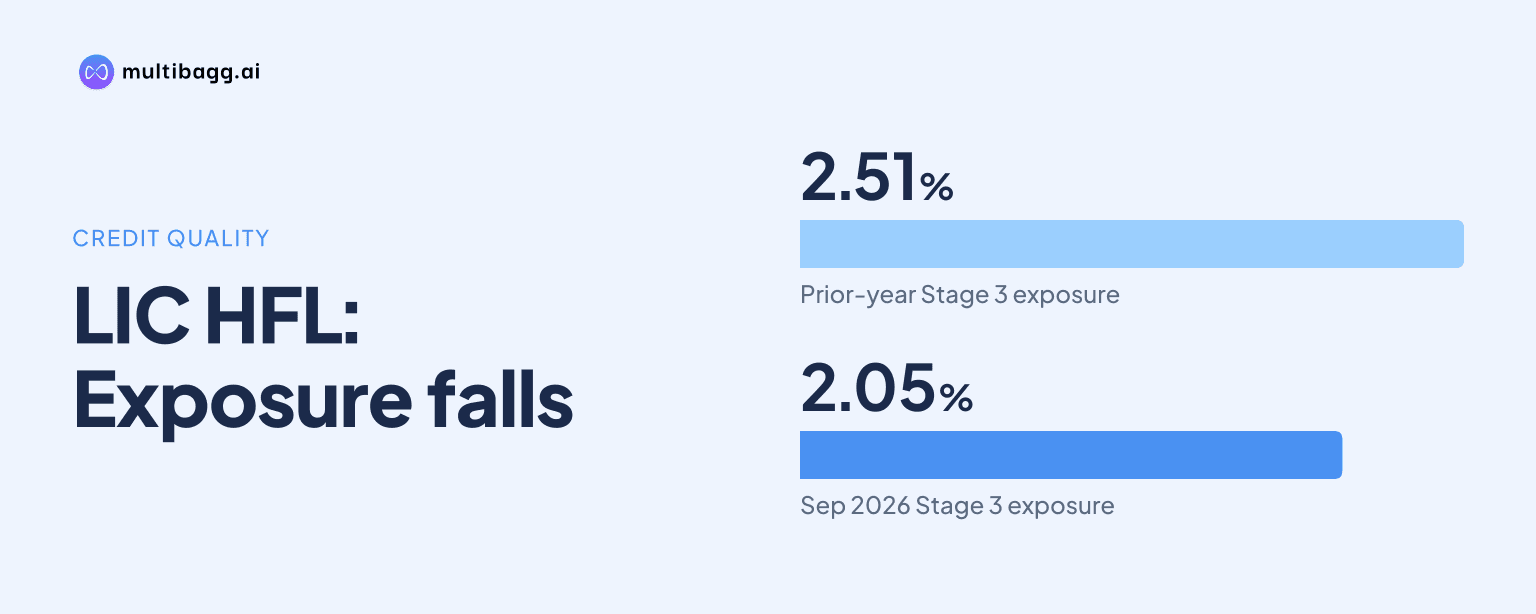
LIC Housing Finance Ltd reduced Stage 3 exposure at default to 2.05% at September 30, 2026, from 2.51% a year earlier, while its outstanding portfolio increased 5% to Rs 3,26,173 crore. LIC HFL also reported total expected credit loss provisions of Rs 4,292 crore, but Stage 3 provision coverage fell to 49% from 53%.
Know LIC Housing Finance inside out
Results, valuation, peers and who's buying, in one view.
How did LIC HFL’s Stage 3 exposure change?
LIC HFL’s Stage 3 exposure at default, or EAD, declined by 46 basis points to 2.05% in September 2026 from 2.51% in September 2025. The September 2026 ratio was also below the 2.16% Stage 3 EAD shown in LIC HFL’s 2026 five-year update, extending the decline from 4.64% in 2022.
Stage 1 represented a larger share of LIC HFL’s exposure mix at September 2026. Stage 1 EAD increased to 95.42% from 94.11% a year earlier, while Stage 2 EAD declined to 2.53% from 3.38%. The combined Stage 2 and Stage 3 share therefore fell to 4.58% from 5.89%.
Why did LIC HFL’s Stage 3 provision coverage decline?
LIC HFL’s presentation does not state why its Stage 3 provision coverage ratio, or PCR, declined to 49% in September 2026 from 53% in September 2025. The reported change means coverage declined by four percentage points even as the Stage 3 EAD ratio fell by 46 basis points.
Stage 3 expected credit loss, or ECL, provisions fell to Rs 3,281.86 crore from Rs 4,156.49 crore, a decrease of Rs 874.63 crore. Stage 2 ECL provisions declined by Rs 23.81 crore to Rs 386.65 crore, whereas Stage 1 ECL provisions increased by Rs 116.26 crore to Rs 623.07 crore.
What happened to LIC HFL’s total ECL provisions?
LIC HFL reported total ECL provisions of Rs 4,292 crore at September 30, 2026, compared with Rs 5,074 crore at September 30, 2025. The reported total, which covers Stage 1, Stage 2 and Stage 3 provisions, was lower by Rs 782 crore year on year.
LIC HFL’s five-year update shows total provisions declining after reaching Rs 7,230 crore in 2023. Total provisions were Rs 6,270 crore in 2024, Rs 4,899 crore in 2025 and Rs 4,569 crore in 2026, while Stage 3 EAD declined from 4.37% in 2023 to 2.16% in 2026.
The September 2026 provision mix retained Stage 3 as the largest component, at Rs 3,281.86 crore, compared with Rs 623.07 crore for Stage 1 and Rs 386.65 crore for Stage 2. LIC HFL does not provide loan-level migration data, loss-rate assumptions or a separate explanation of the lower Stage 3 PCR.
Got a follow-up? Ask IRIS
How did loan-book growth affect LIC HFL’s asset-quality comparison?
LIC HFL’s outstanding portfolio rose 5% to Rs 3,26,173 crore at September 30, 2026, from Rs 3,11,816 crore a year earlier. Retail loans rose 4% to Rs 3,16,433 crore and accounted for 97.0% of the book, while project loans increased 12% to Rs 9,740 crore and represented 3.0%.
The Stage 3 ratio declined while the portfolio expanded by Rs 14,357 crore. In Q2 FY27, retail disbursements rose 10% to Rs 17,563 crore, while project-finance disbursements rose 49% to Rs 564 crore. In H1 FY27, project-finance disbursements were Rs 1,436 crore, up 169% from Rs 534 crore in H1 FY26.
LIC HFL reported a 48% loan-to-value ratio on incremental individual-loan sanctions in both FY26 and H1 FY27, compared with 50% in FY25. The instalment-to-net-income ratio was 42% in H1 FY27 and FY26, compared with 43% in FY25. The presentation does not provide Stage 3 EAD separately for retail and project loans.
What do LIC HFL’s earnings show alongside provisions?
LIC HFL reported net profit of Rs 1,508.78 crore in Q2 FY27, up 11% from Rs 1,353.87 crore in Q2 FY26. Net interest income rose 2% to Rs 2,087.86 crore, while impairment on financial instruments and net loss on derecognition was negative Rs 92.57 crore, compared with Rs 71.99 crore in the prior-year quarter.
For H1 FY27, LIC HFL reported net profit of Rs 2,997.10 crore, up 10% from Rs 2,713.79 crore in H1 FY26. Profit before tax rose 12% to Rs 3,806.98 crore, while net interest margin declined to 2.57% from 2.65%.
LIC HFL’s weighted average cost of funds fell to 7.29% in H1 FY27 from 7.42% in H1 FY26, while yield on advances declined to 9.04% from 9.40%. The resulting spread was 1.75% in H1 FY27, compared with 1.98% in H1 FY26.
Conclusion
LIC HFL’s September 2026 disclosures show lower Stage 3 and Stage 2 EAD ratios, alongside a higher Stage 1 share, as the loan book reached Rs 3,26,173 crore. Total ECL provisions fell to Rs 4,292 crore, led by a Rs 874.63 crore reduction in Stage 3 provisions, but Stage 3 PCR declined to 49% from 53%.
The next asset-quality update will show whether LIC HFL sustains its 2.05% Stage 3 EAD ratio as retail and project portfolios continue to grow. LIC HFL has not disclosed a Stage 3 coverage target or an explanation for the four-percentage-point PCR decline, making subsequent ECL, stage-mix and coverage disclosures the relevant measures to watch.