










Lodha first-half EBITDA margin reaches 39.8% as PAT rises 63%
Key highlights
- Lodha’s 1H FY27 revenue rose 29.8% year on year to Rs 9,460 crore.
- Adjusted EBITDA increased 50.1% to Rs 3,760 crore, lifting the margin to 39.8% from 34.4%.
- PAT grew 62.9% to Rs 2,390 crore, while PAT margin improved to 24.6% from 19.5%.
- Lodha reported September 2026 borrowings of Rs 10,390 crore, cash and bank balances of Rs 3,530 crore, and net debt-to-equity of 0.21 times.
powered by IRIS
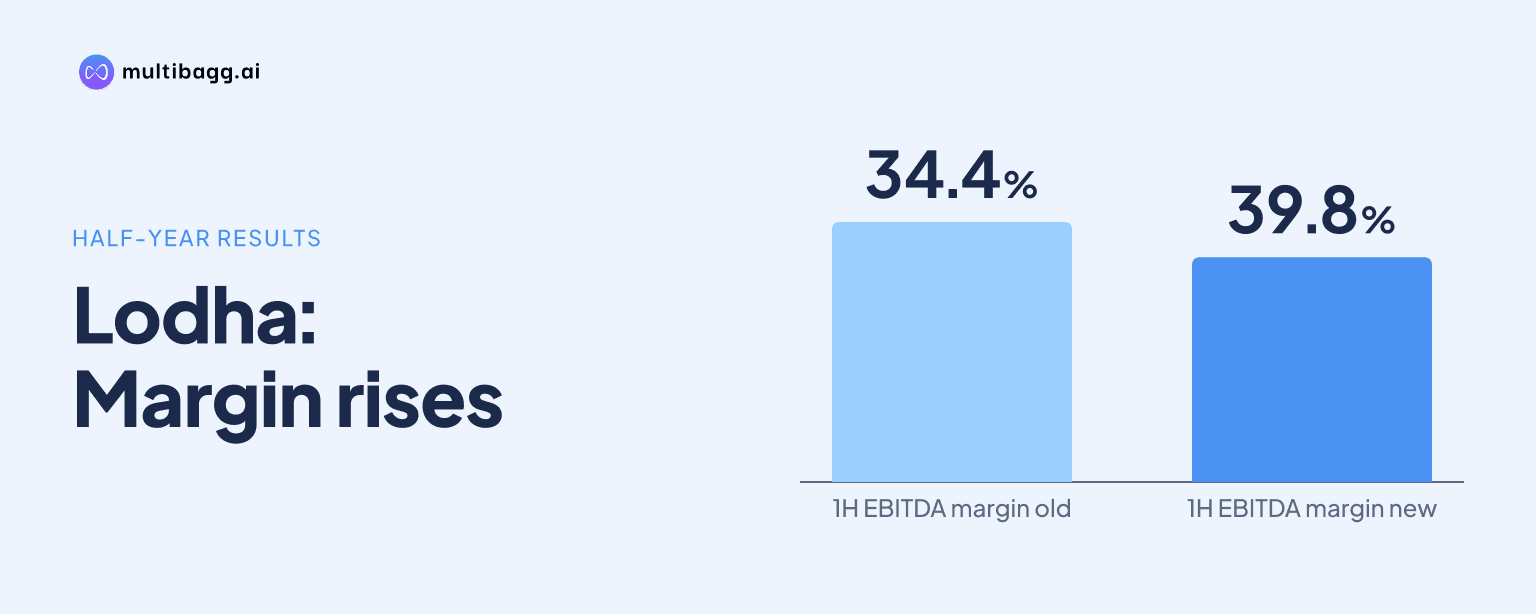
Lodha reported a 540-basis-point rise in first-half FY27 adjusted EBITDA margin to 39.8%, while profit after tax increased 62.9% year on year to Rs 2,390 crore. Revenue grew 29.8% to Rs 9,460 crore, so adjusted operating earnings and profit increased faster than sales during the six-month period.
Know Lodha Developers inside out
Results, valuation, peers and who's buying, in one view.
What drove Lodha’s first-half FY27 earnings growth?
Lodha’s first-half FY27 earnings grew faster than revenue, with adjusted EBITDA rising 50.1% to Rs 3,760 crore and profit after tax, or PAT, increasing 62.9% to Rs 2,390 crore. Revenue rose 29.8% to Rs 9,460 crore from Rs 7,290 crore in 1H FY26. The difference in growth rates lifted adjusted EBITDA margin from 34.4% to 39.8% and PAT margin from 19.5% to 24.6%.
Adjusted EBITDA is defined by Lodha as earnings before interest, tax, depreciation and amortisation after adding finance cost included in project cost. On that basis, adjusted EBITDA increased by Rs 1,250 crore from Rs 2,510 crore in 1H FY26, while PAT increased by Rs 930 crore from Rs 1,460 crore. Revenue rose by Rs 2,170 crore over the same comparison, with operating earnings increasing at a faster percentage rate.
How much did Lodha’s margins improve in first-half FY27?
Lodha’s adjusted EBITDA margin improved by 540 basis points, or 5.4 percentage points, to 39.8% in 1H FY27 from 34.4% in 1H FY26. PAT margin increased by 510 basis points to 24.6% from 19.5%. A basis point equals one-hundredth of a percentage point, and both margin increases accompanied revenue growth of 29.8% in the half year.
The half-year increase exceeded the quarterly movement reported for Q2FY27. Adjusted EBITDA margin in Q2FY27 was 36.2%, up 180 basis points from 34.4% in Q2FY26, while PAT margin was 22.1%, up 170 basis points from 20.4%. Lodha attributed the Q2FY27 expansion in adjusted EBITDA and PAT margins to operating leverage.
The 39.8% first-half adjusted EBITDA margin was 3.6 percentage points above the Q2FY27 margin of 36.2%. First-half PAT margin of 24.6% was 2.5 percentage points above the 22.1% Q2FY27 level. The presentation does not provide separate Q1FY27 profit and loss figures on these pages, but it reports the combined six-month outcome.
How did Lodha’s second-quarter performance compare with last year?
Lodha reported Q2FY27 revenue of Rs 4,470 crore, up 17.6% from Rs 3,800 crore in Q2FY26, while adjusted EBITDA rose 23.5% to Rs 1,610 crore. PAT increased 28.3% to Rs 1,010 crore from Rs 790 crore. Both reported earnings measures therefore grew faster than quarterly revenue.
The quarterly margin movement was smaller than the first-half movement. Adjusted EBITDA margin increased to 36.2% in Q2FY27 from 34.4% a year earlier, compared with the 540-basis-point first-half rise to 39.8%. PAT margin moved to 22.1% from 20.4% in Q2, compared with the 510-basis-point first-half increase to 24.6%.
Got a follow-up? Ask IRIS
What does Lodha’s balance sheet show at September 2026?
Lodha reported net debt-to-equity, or net D/E, of 0.21 times at September 2026, alongside total equity of Rs 25,360 crore. Total equity increased from Rs 23,430 crore at March 2026. At September 2026, total assets were Rs 62,710 crore and total liabilities were Rs 37,350 crore.
Borrowings were Rs 10,390 crore at September 2026, compared with Rs 9,880 crore at March 2026, an increase of Rs 510 crore. Cash and bank balances declined to Rs 3,530 crore from Rs 3,940 crore. Inventories were Rs 40,400 crore versus Rs 40,260 crore, while trade receivables including accrued revenue rose to Rs 4,460 crore from Rs 3,540 crore.
Asset composition changed over the six months to September 2026. Tangible assets increased to Rs 4,060 crore from Rs 2,420 crore, investments rose to Rs 2,510 crore from Rs 1,450 crore, and loans increased to Rs 3,170 crore from Rs 2,870 crore. Total assets grew by Rs 3,770 crore, while total liabilities increased by Rs 1,840 crore.
What development inventory has Lodha disclosed for future growth?
Lodha disclosed unsold gross development value, or GDV, of about Rs 2 lakh crore excluding land forming part of LandCo, which it said was sufficient for the next five years of growth. As of September 2026, DevCo, its development business, had Rs 25,830 crore of residual collections from sold units. DevCo’s completed unsold inventory was 3.9 million square feet and ongoing unsold inventory was 19.1 million square feet.
Lodha added 2.8 million square feet of saleable area in 1H FY27, with estimated GDV of Rs 7,100 crore. Pune accounted for 1.9 million square feet and Rs 2,300 crore of estimated GDV in Q1, while Mumbai Metropolitan Region, or MMR, accounted for 0.9 million square feet and Rs 4,800 crore in Q2. MMR added less area than Pune but had more than twice Pune’s estimated GDV.
For planned DevCo launches, Lodha listed 8.4 million square feet on owned land and 9.1 million square feet in joint development agreement, or JDA, projects for the next 12 months. For the following 12 to 60 months, the pipeline was 52.7 million square feet on owned land and 15.6 million square feet in JDA projects. MMR represented 46.8 million square feet of the later owned-land pipeline and had an approximately 600-million-square-foot land bank.
Conclusion
Lodha’s first-half FY27 figures show profit and adjusted EBITDA growing faster than revenue. Revenue increased 29.8%, adjusted EBITDA rose 50.1%, and PAT increased 62.9%, lifting adjusted EBITDA margin to 39.8% and PAT margin to 24.6%. The company also reported net D/E of 0.21 times at September 2026.
The next disclosed execution measures are Lodha’s 17.5 million square feet of DevCo launches planned for the next 12 months and its 68.3 million square feet pipeline for the following 12 to 60 months. Progress in converting the about Rs 2 lakh crore of unsold GDV, alongside changes in borrowings, cash balances and Rs 25,830 crore of residual collections, will show how the September 2026 position develops.