










M&B net debt-to-equity falls to 0.12 times following IPO
Key highlights
- M&B's net debt-to-equity fell to 0.12 times in FY26 from 0.61 times in FY25.
- M&B's tangible net worth rose to Rs 657.10 crore in FY26 from Rs 306.53 crore in FY25.
- M&B's non-current borrowings fell from Rs 54.21 crore in FY25 to nil in FY26.
- M&B used Rs 58.75 crore of IPO proceeds to prepay a term loan as of September 30, 2026.
powered by IRIS
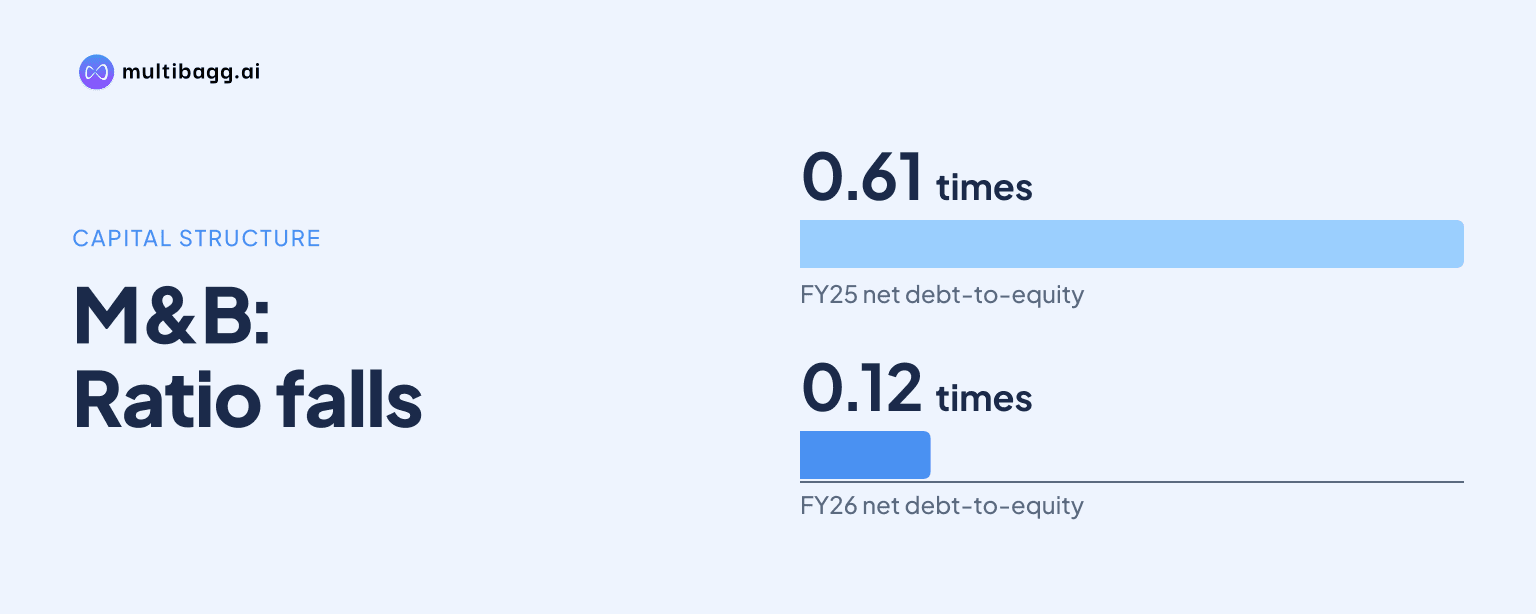
M&B Engineering reported net debt-to-equity of 0.12 times in FY26, down from 0.61 times in FY25, as tangible net worth increased by Rs 350.57 crore to Rs 657.10 crore and non-current borrowings fell to nil. The company later disclosed that it used Rs 58.75 crore of IPO proceeds to prepay a term loan.
Know M & B Engineering inside out
Results, valuation, peers and who's buying, in one view.
How did M&B's leverage change in FY26?
M&B's net debt-to-equity ratio fell by 0.49 times to 0.12 times in FY26 from 0.61 times in FY25. This was the lowest reading in the five-year series presented, following 0.69 times in FY22, 0.82 times in FY23 and 0.88 times in FY24.
The ratio changed alongside both a larger equity base and lower borrowings. Tangible net worth rose from Rs 306.53 crore in FY25 to Rs 657.10 crore in FY26, while equity share capital increased from Rs 50 crore to Rs 57.15 crore and other equity rose from Rs 256.53 crore to Rs 599.96 crore. Profit after tax also increased to Rs 92.64 crore from Rs 77.05 crore.
What happened to M&B's borrowings after the IPO?
M&B reported nil non-current borrowings at the end of FY26, compared with Rs 54.21 crore at the end of FY25. Its non-current financial liabilities were Rs 13.71 crore in FY26, comprising Rs 2.98 crore of lease liabilities, Rs 8.29 crore of deferred tax liabilities and Rs 2.43 crore of other non-current liabilities.
Current borrowings declined by Rs 52.94 crore to Rs 78.98 crore in FY26 from Rs 131.92 crore in FY25. They had stood at Rs 160.96 crore in FY24, showing that FY26 reduced short-term borrowings from both the preceding two year-end levels.
As of September 30, 2026, M&B disclosed that it had utilised Rs 58.75 crore, or 100% of the amount allocated, for prepayment of a term loan from IPO proceeds. Of total net IPO proceeds of Rs 259.32 crore, Rs 155.27 crore, or 59.88%, had been utilised. Capital expenditure accounted for Rs 32.34 crore of utilisation, with Rs 103.44 crore still pending under that allocation.
What changed in M&B's FY26 balance sheet?
M&B's total assets increased by Rs 308.42 crore to Rs 1,157.63 crore in FY26 from Rs 849.21 crore in FY25. Current assets rose by Rs 274.35 crore to Rs 935.76 crore, including inventories of Rs 349.01 crore, trade receivables of Rs 239.14 crore, cash and bank balances of Rs 95.76 crore, and other bank balances of Rs 182.88 crore.
Revenue from operations increased to Rs 1,259.72 crore in FY26 from Rs 988.55 crore in FY25. Over the same period, inventories rose by Rs 26.63 crore and trade receivables rose by Rs 46.78 crore, while current liabilities increased by Rs 10.94 crore to Rs 486.82 crore.
The subsequent H1 FY27 disclosure showed lower working-capital days than in H1 FY26. Inventory days declined to 96 from 106, receivable days fell to 66 from 75, and net working-capital days reduced to 62 from 79. These are half-year operating measures and not FY26 year-end balance-sheet figures.
Got a follow-up? Ask IRIS
Why does M&B show two FY26 operating cash-flow figures?
M&B's audited annual accounts showed net cash outflow from operating activities of Rs 30.88 crore for the year ended March 31, 2026, while its adjusted cash-flow statement showed an inflow of Rs 89.93 crore. The Rs 120.81 crore difference relates to bank fixed deposits earmarked for IPO objects.
The company said the Rs 120.81 crore of IPO fixed deposits had been included as a use of funds in operating activities in the audited accounts, although the deposits were funded from IPO proceeds rather than regular operating cash generation. It therefore moved the amount from operating activities to investing activities in the adjusted presentation.
On the adjusted basis, operating profit before working-capital changes was Rs 142.79 crore in FY26, working-capital changes used Rs 17.10 crore and net direct taxes paid were Rs 35.75 crore. The reclassification did not change closing cash and cash equivalents, which were Rs 95.76 crore in FY26 compared with Rs 29.63 crore in FY25.
How did M&B's earnings and returns move in FY26?
M&B's revenue, earnings before interest, tax, depreciation and amortisation (EBITDA), and profit after tax increased in FY26, although margins were lower than in FY25. Revenue rose by Rs 271.17 crore to Rs 1,259.72 crore, EBITDA increased to Rs 157.19 crore from Rs 134.71 crore, and profit after tax rose to Rs 92.64 crore from Rs 77.05 crore.
EBITDA margin declined to 12.48% in FY26 from 13.63% in FY25, while profit after tax margin declined to 7.4% from 7.8%. Finance costs fell to Rs 17.42 crore from Rs 19.96 crore, whereas depreciation increased to Rs 15.06 crore from Rs 12.52 crore.
Return on equity declined to 19.2% in FY26 from 28.6% in FY25, and return on capital employed declined to 23.1% from 26.3%. The return-on-equity movement coincided with the Rs 350.57 crore increase in tangible net worth, which expanded the equity base against which returns were measured.
Conclusion
M&B's FY26 balance-sheet movement combined nil non-current borrowings, lower current borrowings and a Rs 350.57 crore increase in tangible net worth. Those changes coincided with net debt-to-equity declining to 0.12 times from 0.61 times, while the company disclosed a Rs 58.75 crore IPO-funded term-loan prepayment by September 30, 2026.
The next disclosed balance-sheet item to watch is deployment of the Rs 103.44 crore of capital-expenditure IPO proceeds pending as of September 30, 2026. M&B's H1 FY27 figures also provide measures to follow, including whether inventory days remain below the 106 days reported in H1 FY26 and whether the adjusted operating-cash-flow presentation continues to be used.