










M&B Q2 revenue rises 25% while EBITDA margin falls to 11.3%
Key highlights
- M&B reported Q2FY27 total revenue from operations of Rs 385.17 crore, up 25.0% year on year.
- M&B's Q2FY27 EBITDA was Rs 43.29 crore, while EBITDA margin declined to 11.3% from 12.0%.
- M&B's Q2FY27 PAT rose 32.8% to Rs 29.49 crore and PAT margin increased to 7.7%.
- M&B had Rs 1,109 crore of orders on hand at Q2/H1FY27 and Q2 order inflow of Rs 441 crore.
powered by IRIS
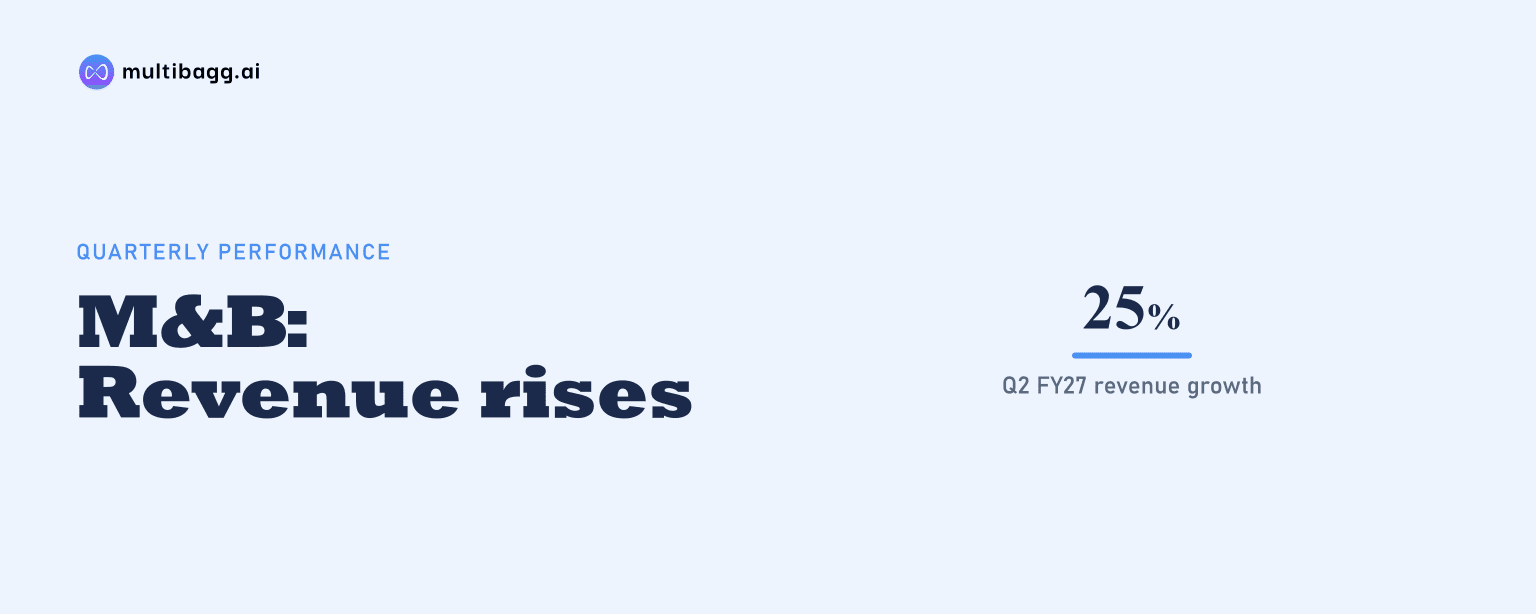
M&B Engineering reported Q2FY27 total revenue from operations of Rs 385.17 crore, up 25.0% year on year, while EBITDA margin fell to 11.3% from 12.0%. Profit after tax rose 32.8% to Rs 29.49 crore, supported by lower finance cost, even as EBITDA growth of 17.6% lagged revenue growth.
Know M & B Engineering inside out
Results, valuation, peers and who's buying, in one view.
How did M&B perform in Q2FY27?
M&B delivered its highest quarterly revenue, according to management, with sales and services increasing 25.4% to Rs 384.67 crore in Q2FY27 from Rs 306.85 crore in Q2FY26. Operative other income declined to Rs 0.50 crore from Rs 1.41 crore, resulting in total revenue from operations of Rs 385.17 crore versus Rs 308.26 crore. Management attributed the revenue growth to both the Phenix pre-engineered buildings business and the Proflex self-supported roofing division.
M&B's EBITDA, or earnings before interest, tax, depreciation and amortisation, including other income, rose 17.6% to Rs 43.29 crore from Rs 36.82 crore. Since this increase was below the 25.0% rise in revenue from operations, EBITDA margin declined by 70 basis points, or hundredths of a percentage point, to 11.3% from 12.0%. The presentation does not specify the reason for the quarterly margin movement.
M&B's profit after tax, or PAT, increased faster than revenue, reaching Rs 29.49 crore from Rs 22.20 crore, and PAT margin improved to 7.7% from 7.2%. Profit before tax before exceptional items rose 24.9% to Rs 35.94 crore, while finance cost fell to Rs 3.13 crore from Rs 4.36 crore. Depreciation and amortisation increased to Rs 4.22 crore from Rs 3.68 crore.
What changed in M&B's first-half performance?
M&B reported H1FY27 sales and services of Rs 675.77 crore, up 24.1% from Rs 544.51 crore in H1FY26, and total revenue from operations of Rs 678.86 crore, up 23.5% from Rs 549.57 crore. Management described this as its highest-ever first-half revenue. Operative other income was Rs 3.09 crore in H1FY27, below Rs 5.06 crore a year earlier.
M&B's H1FY27 EBITDA increased 12.1% to Rs 79.05 crore from Rs 70.50 crore, but its margin moved to 11.7% from 13.0% in the detailed profit and loss statement. The financial-performance summary displays the prior-period margin as 12.9%, while both disclosures show an 11.7% H1FY27 margin. In either presentation, EBITDA growth was below the 23.5% increase in total revenue from operations.
M&B's H1FY27 PAT rose 28.0% to Rs 51.39 crore from Rs 40.14 crore and PAT margin increased to 7.6% from 7.4%. Finance cost declined by Rs 4.11 crore to Rs 5.93 crore, while profit before tax increased 22.6% to Rs 65.21 crore. Non-operating other income rose to Rs 4.50 crore from Rs 1.47 crore, including Rs 3.18 crore of interest on fixed deposits for the initial public offering.
Got a follow-up? Ask IRIS
How did M&B's domestic and export business change?
M&B's sales within India increased to Rs 317.43 crore in Q2FY27 from Rs 253.06 crore in Q2FY26, while sales outside India rose to Rs 67.24 crore from Rs 53.79 crore. Domestic sales added Rs 64.37 crore and outside-India sales added Rs 13.45 crore year on year. The presentation does not disclose profitability by domestic and international market.
M&B's Phenix division generated Rs 298 crore of Q2FY27 revenue, comprising 76% from industry and infrastructure, 23% from exports and 1% that was not labelled in the presentation. In H1FY27, Phenix revenue was Rs 512 crore, with industry and infrastructure at 80% and exports at 19%. The lower first-half export share reflects the inclusion of Q1FY27 and is not a separate Q1 revenue disclosure.
M&B's Proflex division contributed Rs 87 crore in Q2FY27 and Rs 163 crore in H1FY27. Warehousing was its largest disclosed sector in both periods, accounting for 56% of Q2 revenue and 49% of H1 revenue. Industry represented 23% in Q2 and 30% in H1, while railways accounted for 14% and 13%, respectively.
What do M&B's orders, capacity and cash deployment show?
M&B had orders on hand of Rs 1,109 crore at Q2/H1FY27, which management said was 19% higher year on year and above Rs 1,083 crore at FY26. Q2FY27 order inflow was Rs 441 crore, up 12% from Rs 395 crore in Q2FY26 and 69% from Rs 262 crore in Q1FY27. H1FY27 order inflow totalled Rs 703 crore.
M&B's Q2FY27 order mix comprised 62% Phenix domestic, 24% Proflex and 14% Phenix export, compared with 66%, 21% and 13%, respectively, in Q2FY26. In the Rs 1,109 crore orders-on-hand balance, Phenix domestic represented 54%, Phenix export 25% and Proflex 21%. Phenix held Rs 874 crore of H1FY27 orders on hand, with export accounting for 31%, while Proflex held Rs 235 crore.
M&B said Phase I of Sanand's brownfield expansion had started commercial production, adding 20,000 metric tonnes per annum and taking combined pre-engineered building capacity at Sanand and Cheyyar to about 124,000 metric tonnes per annum. Management also cited a data-centre order, a high-rise building order and CE certification from TÜV NORD for Sanand as developments supporting European pre-engineered building and structural-steel opportunities.
M&B had used Rs 155.27 crore, or 59.88%, of Rs 259.32 crore in net initial-public-offering proceeds as of September 30, 2026. It had fully deployed Rs 58.75 crore for term-loan prepayment, used Rs 64.18 crore of Rs 64.79 crore for general corporate purposes, and deployed Rs 32.34 crore of Rs 135.78 crore earmarked for capital expenditure. The first-half working-capital cycle reduced to 62 days from 79 days, as inventory days fell to 96 from 106 and receivable days to 66 from 75.
Conclusion
M&B combined 25.0% Q2FY27 growth in revenue from operations with a 32.8% increase in PAT, as lower finance cost helped lift profit after tax and PAT margin. The central operating comparison is that EBITDA increased 17.6%, below revenue growth, and quarterly EBITDA margin declined to 11.3%. First-half results showed the same pattern, with 12.1% EBITDA growth against 23.5% growth in total revenue from operations.
Investors can next assess management's stated aim of delivering more than 25% revenue growth in FY27 and its target of more than 20% compound annual revenue growth over the following three to four years, alongside progressive profitability improvement. Execution of the remaining Rs 103.44 crore of capital-expenditure proceeds, output from the additional 20,000 metric tonnes per annum at Sanand, and changes in domestic and export order mix are the disclosed measures to watch.