










M&B Engineering Q2 revenue reaches Rs 385 crore, PAT rises 33%
Key highlights
- M&B Engineering reported Q2FY27 revenue from operations of Rs 385.17 crore, up 25.0% year on year.
- M&B Engineering’s Q2FY27 PAT rose 32.8% to Rs 29.49 crore, while EBITDA margin declined to 11.3% from 12.0%.
- M&B Engineering’s sales outside India rose 25.0% to Rs 67.24 crore in Q2FY27.
- M&B Engineering reduced net working-capital days to 62 in H1FY27 from 79 days in H1FY26.
powered by IRIS
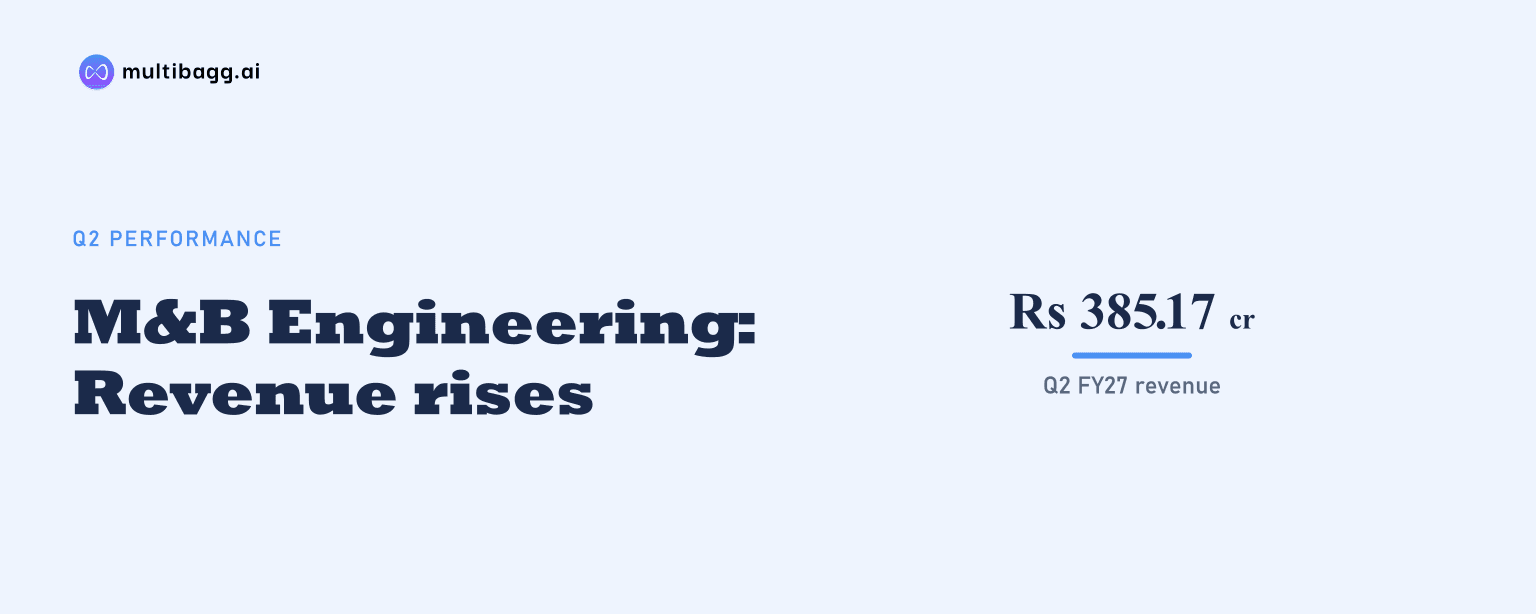
M&B Engineering Limited reported Q2FY27 revenue from operations of Rs 385.17 crore, up 25.0% year on year, while profit after tax (PAT) rose 32.8% to Rs 29.49 crore. Sales and services grew 25.4% to Rs 384.67 crore, although the earnings before interest, tax, depreciation and amortisation (EBITDA) margin declined to 11.3% from 12.0%.
Know M & B Engineering inside out
Results, valuation, peers and who's buying, in one view.
How did M&B Engineering perform in Q2FY27?
M&B Engineering increased revenue from operations by Rs 76.91 crore from Rs 308.26 crore in Q2FY26 to Rs 385.17 crore in Q2FY27. Sales and services, its main operating revenue line, rose 25.4% to Rs 384.67 crore from Rs 306.85 crore. Operative other income declined to Rs 50 lakh from Rs 1.41 crore, reducing its contribution to operating revenue.
Total income, including non-operating other income, rose 25.2% to Rs 387.18 crore from Rs 309.18 crore. Non-operating other income increased to Rs 2.01 crore from Rs 92 lakh, including Rs 1.62 crore of interest on fixed deposits for the initial public offering (IPO). This income was separate from sales and services.
PAT increased by Rs 7.29 crore from Rs 22.20 crore in Q2FY26 to Rs 29.49 crore in Q2FY27. Profit before tax, before exceptional items, rose 24.9% to Rs 35.94 crore. PAT grew faster than revenue and EBITDA, while PAT margin increased by 0.5 percentage points to 7.7% from 7.2%.
What drove M&B Engineering’s Q2FY27 sales growth?
M&B Engineering’s sales within India rose 25.4% to Rs 317.43 crore in Q2FY27 from Rs 253.06 crore a year earlier. Sales outside India increased 25.0% to Rs 67.24 crore from Rs 53.79 crore. Domestic sales accounted for Rs 64.37 crore of the Rs 77.82 crore increase in consolidated sales and services.
The source reports both geographic markets grew at similar rates in Q2FY27, but it does not disclose a separate profit or margin measure for domestic and overseas operations. Sales outside India were Rs 67.24 crore against total sales and services of Rs 384.67 crore, while India sales were Rs 317.43 crore.
Proflex sales volume rose to 4,71,676 square metres in Q2FY27 from 3,66,675 square metres in Q2FY26, an increase of 1,05,001 square metres. Phenix sales volume increased by 2,400 metric tonnes to 19,254 metric tonnes from 16,854 metric tonnes, alongside the 25.4% growth in sales and services.
Why did M&B Engineering’s PAT outpace EBITDA in Q2FY27?
M&B Engineering’s EBITDA rose 17.6% to Rs 43.29 crore in Q2FY27, below the 25.0% increase in revenue from operations. EBITDA margin therefore declined by 0.7 percentage points to 11.3% from 12.0%. The supplied results disclose the margin movement but do not provide a cost-line explanation for it.
Finance cost fell 28.2% to Rs 3.13 crore from Rs 4.36 crore, reducing a charge below EBITDA. Non-operating other income increased by Rs 1.09 crore to Rs 2.01 crore, while depreciation and amortisation rose by Rs 54 lakh to Rs 4.22 crore. These movements coincided with PAT rising 32.8%, faster than EBITDA growth.
The same margin pattern appeared in the first half. H1FY27 EBITDA margin was 11.7%, compared with 13.0% in H1FY26, while PAT margin increased to 7.6% from 7.4%. M&B Engineering reported H1FY27 EBITDA of Rs 79.05 crore and PAT of Rs 51.39 crore.
Got a follow-up? Ask IRIS
How did M&B Engineering perform in H1FY27?
M&B Engineering reported H1FY27 sales and services of Rs 675.77 crore, up 24.1% from Rs 544.51 crore in H1FY26. Revenue from operations rose 23.5% to Rs 678.86 crore from Rs 549.57 crore. Operative other income declined to Rs 3.09 crore from Rs 5.06 crore over the same period.
H1FY27 PAT rose 28.0% to Rs 51.39 crore from Rs 40.14 crore, while profit before tax increased 22.6% to Rs 65.21 crore. Finance cost fell to Rs 5.93 crore from Rs 10.04 crore, whereas depreciation and amortisation increased to Rs 7.91 crore from Rs 7.26 crore.
Sales outside India grew 68.1% to Rs 95.44 crore in H1FY27 from Rs 56.79 crore, exceeding the 19.0% increase in sales within India to Rs 580.33 crore. Proflex volume rose to 8,95,535 square metres from 6,87,728 square metres, and Phenix volume increased to 36,382 metric tonnes from 31,674 metric tonnes.
What changed in M&B Engineering’s working capital and IPO deployment?
M&B Engineering reduced net working-capital days to 62 in H1FY27 from 79 in H1FY26. Inventory days fell to 96 from 106 and receivable days declined to 66 from 75. Trade-creditor days reduced to 66 from 70, while customer-advance days increased to 35 from 32.
Working-capital balances nevertheless increased in absolute terms. Inventory rose to Rs 358.31 crore from Rs 318.67 crore and receivables increased to Rs 246.71 crore from Rs 227.23 crore. Trade creditors, including buyer’s credit, rose to Rs 243.73 crore from Rs 212.04 crore, while customer advances increased to Rs 129.71 crore from Rs 95.87 crore.
As of September 30, 2026, M&B Engineering had used Rs 155.27 crore, or 59.88%, of Rs 259.32 crore in net IPO proceeds. It had fully used Rs 58.75 crore for term-loan prepayment and deployed Rs 64.18 crore of Rs 64.79 crore for general corporate purposes. Capital-expenditure use stood at Rs 32.34 crore of Rs 135.78 crore, leaving Rs 103.44 crore pending.
Conclusion
M&B Engineering’s Q2FY27 results combined 25.0% growth in revenue from operations to Rs 385.17 crore with 32.8% growth in PAT to Rs 29.49 crore. Domestic and overseas sales both increased in the quarter, and Proflex and Phenix volumes rose, while lower finance cost and higher non-operating income coincided with PAT outpacing EBITDA despite the lower EBITDA margin.
The next disclosed item to watch is deployment of Rs 104.05 crore of IPO proceeds that remained unutilised on September 30, 2026, including Rs 103.44 crore earmarked for capital expenditure. M&B Engineering also identified renewables, cold storage, warehousing, railways and agriculture as emerging opportunities expected to drive future growth, alongside an orders-on-hand figure of Rs 1,109 crore for Q2FY27 and H1FY27.