










Mitsu FY26 recovery lifts ROE and interest coverage to 4.31
Key highlights
- Mitsu’s FY26 revenue rose to Rs 350.17 crore from Rs 332.28 crore, while PAT increased to Rs 15.62 crore from Rs 7.25 crore.
- FY26 EBITDA margin improved to 10% from 7%, with EBITDA rising to Rs 34.79 crore from Rs 23.28 crore.
- Mitsu’s debt-to-equity ratio declined to 0.52 times at Mar-26 from 0.71 times a year earlier, as total borrowings fell to Rs 58.99 crore.
- Capital work-in-progress increased by Rs 31.28 crore to Rs 32.65 crore between Mar-26 and Sep-26, while long-term borrowings rose by Rs 42.63 crore to Rs 53.16 crore.
powered by IRIS
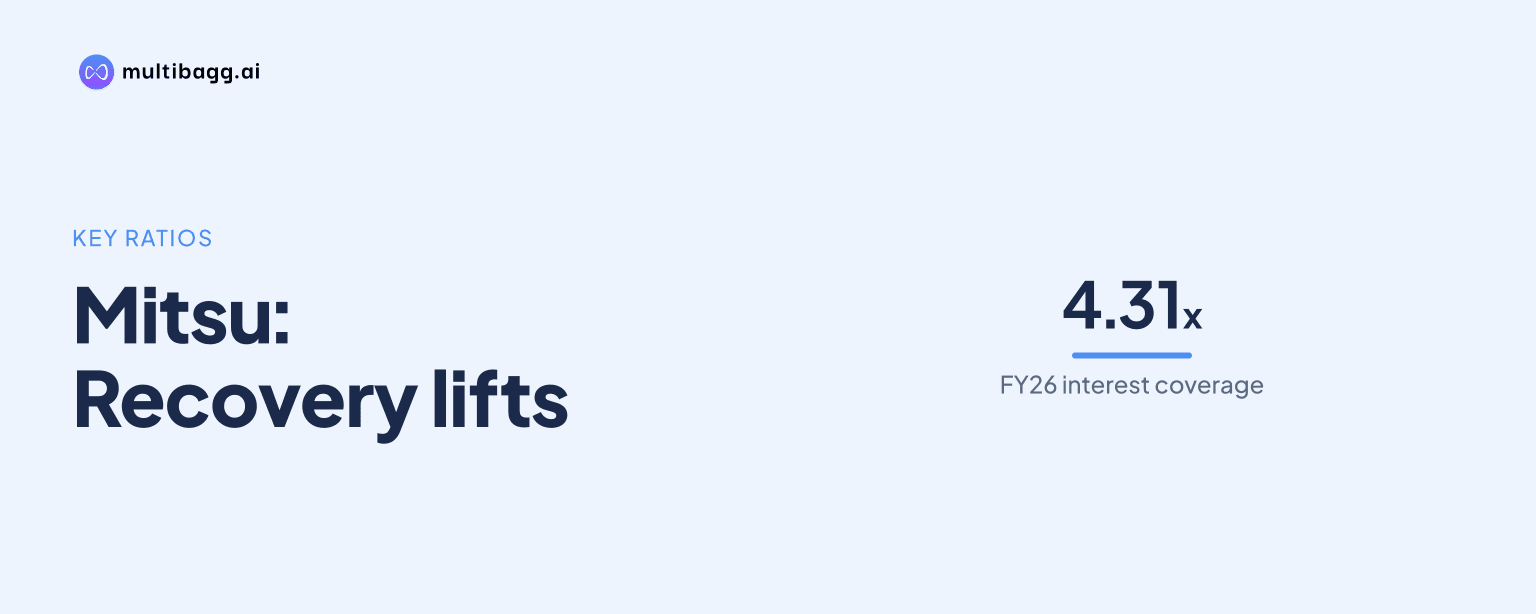
Mitsu Chem Plast Ltd. improved reported returns and debt-service capacity in FY26, with return on equity rising to 14% from 7% and interest coverage reaching 4.31 times from 2.43 times. By Sep-26, Mitsu had increased capital work-in-progress to Rs 32.65 crore and long-term borrowings to Rs 53.16 crore.
Know Mitsu Chem Plast inside out
Results, valuation, peers and who's buying, in one view.
How did Mitsu’s FY26 profitability recover?
Mitsu’s FY26 profitability recovered as revenue from operations rose to Rs 350.17 crore from Rs 332.28 crore in FY25, while earnings before interest, tax, depreciation and amortisation (EBITDA) increased to Rs 34.79 crore from Rs 23.28 crore. EBITDA margin increased to 10% from 7%, and profit after tax (PAT) reached Rs 15.62 crore from Rs 7.25 crore.
The FY26 result reversed the decline recorded in FY25, when EBITDA fell from Rs 25.67 crore in FY24 to Rs 23.28 crore and PAT declined from Rs 8.86 crore to Rs 7.25 crore. Raw-material cost was broadly unchanged at Rs 211.57 crore in FY26 versus Rs 211.97 crore in FY25, while employee expense rose to Rs 26.91 crore and other expenses to Rs 76.91 crore.
Mitsu’s earnings before interest and tax (EBIT) rose to Rs 27.15 crore in FY26, compared with Rs 16.39 crore in FY25 and Rs 19.65 crore in FY24. Finance cost declined for a second year to Rs 6.43 crore from Rs 6.99 crore in FY25 and Rs 8.80 crore in FY24, while depreciation increased to Rs 7.64 crore from Rs 6.89 crore.
Why did Mitsu’s return ratios and interest coverage improve?
Mitsu’s return ratios and interest coverage improved in FY26 as reported profitability rose while debt to equity declined. Return on equity (ROE) increased to 14% from 7% in FY25, and return on capital employed (ROCE) rose to 15% from 10%; both measures were also above FY24 levels of 11% and 13%, respectively.
Interest coverage rose to 4.31 times in FY26 from 2.43 times in FY25 and 2.35 times in FY24. The change coincided with FY26 EBIT of Rs 27.15 crore and finance cost of Rs 6.43 crore. Debt to equity fell to 0.52 times from 0.71 times in FY25 and 1.01 times in FY24.
Equity expanded to Rs 112.41 crore at Mar-26 from Rs 96.98 crore at Mar-25, including other equity of Rs 98.83 crore versus Rs 83.40 crore. Combined current and non-current borrowings fell to Rs 58.99 crore at Mar-26 from Rs 68.96 crore a year earlier, based on the balance-sheet classifications.
Which revenue segments drove Mitsu’s FY26 growth?
Mitsu’s industrial packaging business remained its largest revenue segment in FY26 at Rs 293.71 crore, up from Rs 286.39 crore in FY25. Hospital furniture parts grew to Rs 46.31 crore from Rs 38.38 crore, while infrastructural furniture and others rose to Rs 10.15 crore from Rs 7.51 crore.
Hospital furniture parts added Rs 7.93 crore of segment revenue in FY26, slightly more than the Rs 7.32 crore increase in industrial packaging despite its smaller base. The hospital furniture parts segment had generated Rs 30.05 crore in FY24, while industrial packaging recorded Rs 266.74 crore. Mitsu says it is accelerating its transition beyond industrial packaging through hospital furniture parts, healthcare and intermediate bulk container opportunities.
Revenue from the top 10 customers increased to Rs 88.94 crore in FY26 from Rs 72.48 crore in FY25, while revenue from other customers rose to Rs 261.23 crore from Rs 259.80 crore. The top-10-customer figure was Rs 72.13 crore in FY24, compared with Rs 239.12 crore from other customers.
Got a follow-up? Ask IRIS
What changed on Mitsu’s balance sheet by Sep-26?
Mitsu’s balance sheet shifted toward capital investment by Sep-26, when non-current assets reached Rs 150.44 crore from Rs 109.79 crore at Mar-26. Capital work-in-progress increased to Rs 32.65 crore from Rs 1.37 crore, while property, plant and equipment rose to Rs 101.73 crore from Rs 95.68 crore.
Total assets reached Rs 259.90 crore at Sep-26, compared with Rs 217.86 crore at Mar-26. Current assets changed modestly to Rs 109.45 crore from Rs 108.07 crore: inventories declined to Rs 37.04 crore from Rs 43.05 crore, while trade receivables increased to Rs 64.77 crore from Rs 58.24 crore.
Mitsu’s non-current liabilities rose to Rs 66.83 crore at Sep-26 from Rs 22.13 crore at Mar-26, led by long-term borrowings of Rs 53.16 crore. Current liabilities fell to Rs 66.18 crore from Rs 83.33 crore, as trade payables decreased to Rs 9.61 crore from Rs 24.46 crore and current borrowings declined to Rs 43.32 crore from Rs 48.46 crore.
How was Mitsu’s Sep-26 investment funded?
Mitsu funded the investment period with financing inflows alongside operating cash generation. For the period labelled Sep-26, net cash from operating activities was Rs 9.02 crore, net cash used in investing activities was Rs 42.99 crore, and net cash from financing activities was Rs 33.98 crore.
This contrasts with FY26, when Mitsu generated Rs 32.77 crore from operating activities, used Rs 16.35 crore in investing activities and reported Rs 16.42 crore of financing outflows. The Sep-26 cash-flow statement recorded profit before tax of Rs 20.11 crore, cash generated from operations of Rs 13.56 crore and taxes paid of Rs 4.54 crore.
Closing cash and cash equivalents were Rs 5.5 lakh at Sep-26, compared with Rs 5.2 lakh at Mar-26. The statement reported a Rs 0.3 lakh net increase in cash for the period labelled Sep-26, but it did not identify the project represented by the Rs 32.65 crore capital work-in-progress balance.
Conclusion
Mitsu’s FY26 accounts show higher earnings, margins and reported return measures after the FY25 decline. Revenue reached Rs 350.17 crore, PAT rose to Rs 15.62 crore, ROE increased to 14%, and interest coverage reached 4.31 times as finance cost declined and debt to equity fell to 0.52 times.
The next item to watch is the deployment of capital work-in-progress, which rose by Rs 31.28 crore between Mar-26 and Sep-26 alongside a Rs 42.63 crore increase in long-term borrowings. Mitsu has disclosed an emphasis on healthcare, hospital furniture parts and intermediate bulk container opportunities, but has not identified the project, completion timetable or expected financial contribution.