










MSWIL Q2 revenue rose 47% on launches and greenfield plants
Key highlights
- MSWIL revenue increased 47% year-on-year and 19% sequentially in Q2 FY27.
- Passenger-vehicle industry volumes rose 25% year-on-year, compared with MSWIL’s 47% revenue growth.
- MSWIL’s EBITDA margin rose to 9.2% in Q2 FY27 from 7.6% in Q1 FY27.
- EVs accounted for 10% of MSWIL revenue in Q2 FY27 and 9.3% in H1 FY27.
powered by IRIS
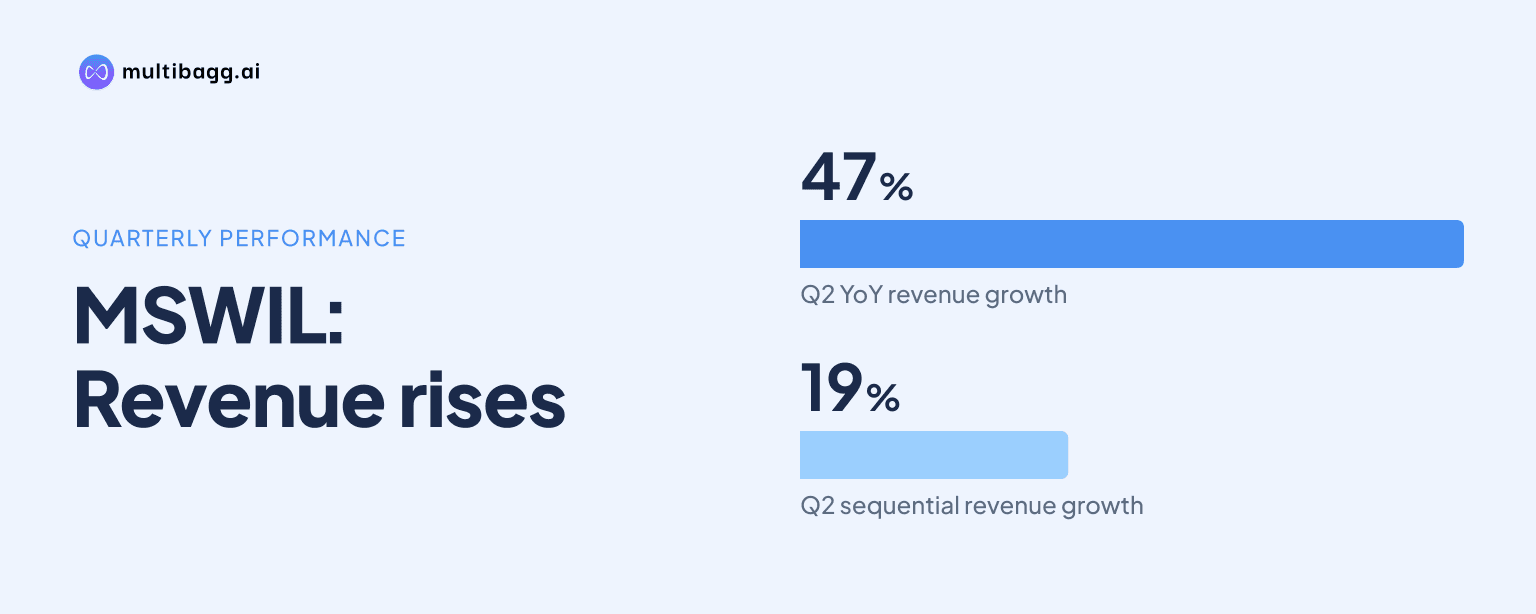
Motherson Sumi Wiring India Limited reported 47% year-on-year revenue growth in Q2 FY27, supported by higher customer volumes, new programme launches and output from three greenfield plants. MSWIL also grew revenue 19% sequentially, while management said the new facilities had reached optimal utilisation.
Know Motherson Sumi Wiring India inside out
Results, valuation, peers and who's buying, in one view.
Why did MSWIL revenue rise 47% in Q2 FY27?
MSWIL said its 47% year-on-year and 19% quarter-on-quarter revenue growth in Q2 FY27 was driven by higher customer volumes, new programme launches and contributions from its greenfield facilities. The company’s reported growth exceeded the passenger-vehicle industry’s 25% year-on-year and 14% sequential volume growth during the quarter, according to management’s comparison.
The difference between MSWIL’s revenue growth and the underlying passenger-vehicle volume increase reflects more than volume alone, based on management’s stated drivers. The company cited participation in new model launches across electric-vehicle, or EV, and internal-combustion-engine, or ICE, platforms, as well as vehicle premiumisation that increases wiring content per vehicle. These factors were presented alongside higher customer production volumes, rather than as a separately quantified contribution.
Earnings measures also increased, although at rates below revenue growth on a year-on-year basis. Earnings before interest, tax, depreciation and amortisation, or EBITDA, rose 34% year-on-year and 45% sequentially, while profit after tax rose 35% and 54%, respectively. The sequential acceleration in EBITDA and profit after tax coincided with an EBITDA margin improvement to 9.2% from 7.6% in Q1 FY27.
How did the three greenfield plants support MSWIL volumes?
MSWIL said its three greenfield plants contributed meaningfully to Q2 FY27 growth by enabling it to support higher customer volumes. Management said the ramp-ups had progressed well and that the facilities were operating at an optimal utilisation level, shifting them from start-up operations into the company’s regular capacity base.
That operational shift also affected the cost base. Management explained that greenfield sites initially carried costs before revenues began to flow; as output and revenue rise, expense ratios improve. This mechanism helps explain why MSWIL’s EBITDA margin increased by 1.6 percentage points sequentially, from 7.6% in Q1 FY27 to 9.2% in Q2 FY27, even as input-cost pressures remained.
Management said it had continued building capacity even when growth had slowed, aiming to be prepared for the subsequent increase in demand. In the October 30, 2026 call, it said the completed ramp-ups meant the company was ready for the festive period. This is an operational-readiness statement, not a numerical capacity-expansion target or a forecast for plant output.
Got a follow-up? Ask IRIS
What role did new models and vehicle content play for MSWIL?
MSWIL identified new model launches and higher wiring content per vehicle as contributors to Q2 FY27 growth alongside customer volume. Management linked higher content to vehicle premiumisation and said the company was participating in launches on both EV and ICE platforms, which broadens the programme base supporting revenue.
EVs represented 10% of MSWIL revenue in Q2 FY27 and 9.3% in the first half of FY27. The 0.7-percentage-point difference shows that EVs contributed a somewhat higher proportion of revenue in the second quarter than across the first half, although management did not disclose EV revenue in rupees or the number of EV programmes launched.
The company’s framing is important because passenger-vehicle industry volumes rose 25% year-on-year while MSWIL revenue increased 47%. Management attributed the outperformance to its ability to capture opportunities, higher content per vehicle, new programmes and greenfield-plant contributions. The call did not allocate the 22-percentage-point gap between revenue and industry volume growth among those individual drivers.
What could affect MSWIL margins after Q2 FY27?
Copper prices and wage costs remain the principal disclosed pressures on MSWIL’s margins after Q2 FY27. Copper prices rose about 6% sequentially and 54% year-on-year, while the company also cited minimum-wage revisions and other inflationary pressures. Despite those factors, EBITDA margin reached 9.2% in Q2 FY27, compared with 7.6% in Q1 FY27.
Management said copper is generally a pass-through item, with recovery from most customers taking about three months. In some smaller cases, management said the lag can extend to six months. It said it was in discussions with customers on recovery of copper and wage-related increases, while seeking full recovery of wage inflation, which remains under negotiation.
Chief Operating Officer Anurag Gahlot said that, because copper has roughly a one-quarter lag for most customers, the company expects recovery to affect the next quarter. He also said localisation of imported components remains an ongoing effort. These comments identify mechanisms that could affect future performance, but management did not provide a margin target or quantify pending recoveries.
Conclusion
MSWIL’s Q2 FY27 revenue growth was supported by several disclosed operational factors: customer volumes rose, new vehicle programmes were launched, premiumisation increased content per vehicle, and three greenfield plants reached optimal utilisation. Revenue grew 47% year-on-year versus 25% passenger-vehicle industry volume growth, while the EBITDA margin rose to 9.2% from 7.6% in Q1 FY27.
Next, investors will watch whether the festive-period momentum referred to by management continues despite a higher second-half comparison base following the prior year’s Goods and Services Tax reduction. They will also watch the timing of copper and wage-cost recoveries, which management said generally involve a three-month copper lag, with certain cases extending to six months.