










MTAR cuts working-capital days to 50, operating cash Rs 350 crore
Key highlights
- MTAR’s total working-capital days fell to 50 at Sep-26 from 266 at Dec-25, a reduction of 216 days.
- MTAR generated net operating cash flow of Rs 350.0 crore for the period ended 30-Sep-26, up from Rs 39.8 crore a year earlier.
- MTAR’s H1FY27 revenue rose 162.7% year on year to Rs 767.5 crore, while EBITDA margin increased to 24.0% from 15.5%.
- MTAR reported an order book of Rs 5,976.5 crore at 30-Sep-26, including Rs 1,207.2 crore of Q2FY27 order intake.
powered by IRIS
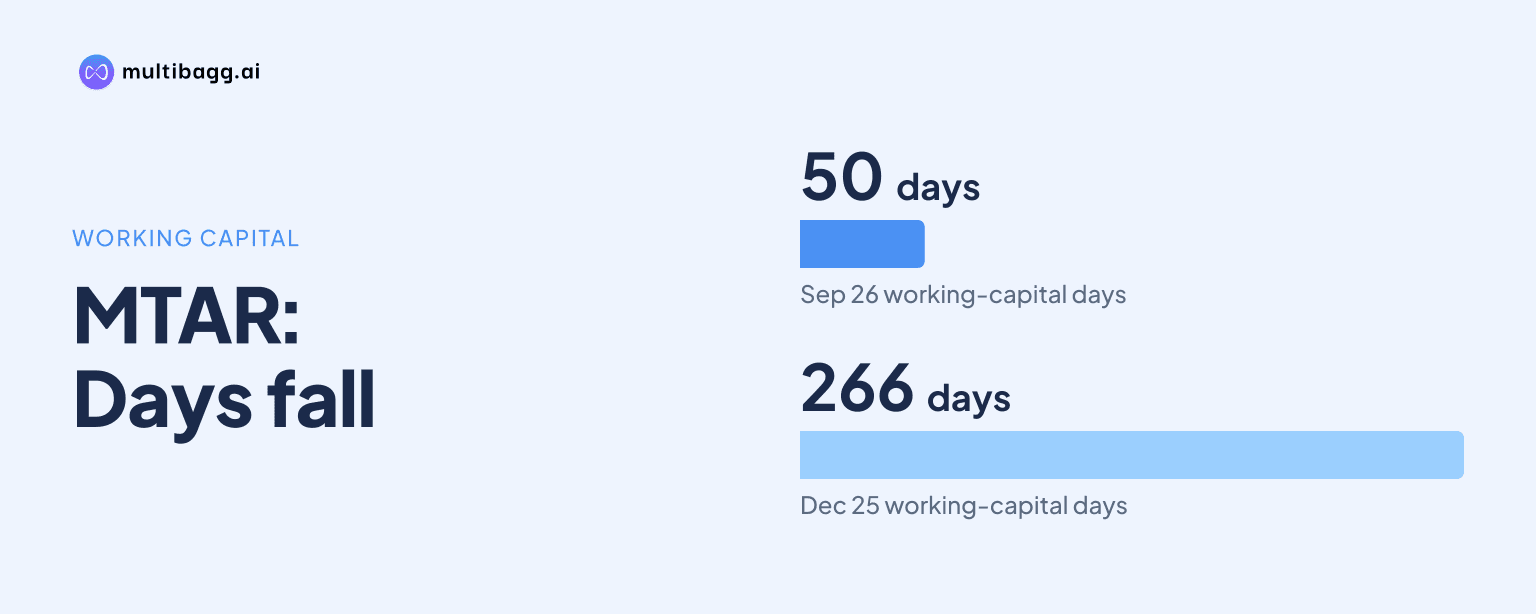
MTAR reported total working-capital days of 50 at Sep-26, down from 266 at Dec-25, while net cash from operating activities reached Rs 350.0 crore for the period ended 30-Sep-26. The cash result included Rs 195.0 crore from working-capital changes, even as inventories and current liabilities increased from Mar-26.
Know MTAR Technologies inside out
Results, valuation, peers and who's buying, in one view.
How did MTAR reduce working-capital days to 50?
MTAR reduced total working-capital days by 216 days, from 266 at Dec-25 to 50 at Sep-26. Working capital other than work-in-progress, or WIP, fell from 161 days to negative five days, while WIP declined from 105 days to 55 days. The other-than-WIP measure accounted for 166 days of the reported reduction.
The movement occurred through each reported period. Total working-capital days fell to 172 at Mar-26, 60 at Jun-26 and 50 at Sep-26. WIP days declined from 105 at Dec-25 to 88, 56 and 55 days in the subsequent three reporting points, while other-than-WIP days moved from 84 at Mar-26 to three at Jun-26 before becoming negative.
MTAR’s Q2FY27 metrics show that the lower total was not driven by inventory days alone. Receivables fell to 68 days in Q2FY27 from 82 in Q1FY27, while inventory increased to 162 from 145 days. Current-liability days increased to 180 from 167 days, exceeding the 17-day rise in inventory days.
Raw-material days increased to 107 in Q2FY27 from 89 in Q1FY27, whereas WIP days were 55 compared with 56. The presentation therefore records higher inventory and raw-material days alongside lower receivable days and higher current-liability days at Sep-26.
What balance-sheet movements accompanied MTAR’s working-capital change?
MTAR’s current liabilities increased to Rs 1,195.7 crore at Sep-26 from Rs 726.8 crore at Mar-26, a rise of Rs 468.9 crore. Other current liabilities increased by Rs 223.8 crore to Rs 478.7 crore, trade payables rose by Rs 109.9 crore to Rs 259.8 crore, and current borrowings increased by Rs 96.9 crore to Rs 318.5 crore.
Current assets rose by Rs 316.4 crore to Rs 1,444.6 crore over the same period. Inventories increased by Rs 178.3 crore to Rs 678.8 crore, while trade receivables declined by Rs 51.0 crore to Rs 285.8 crore. Current investments rose by Rs 146.7 crore to Rs 362.0 crore, and cash and cash equivalents were Rs 0.3 crore at Sep-26, compared with Rs 1.0 crore at Mar-26.
MTAR also reported higher non-current operating assets at Sep-26. Property, plant and equipment increased to Rs 637.8 crore from Rs 497.2 crore, and capital work-in-progress rose to Rs 112.9 crore from Rs 34.4 crore. Together these categories increased by Rs 219.1 crore, while total non-current assets rose by Rs 268.4 crore to Rs 883.6 crore.
Total equity and liabilities were Rs 2,328.2 crore at Sep-26, compared with Rs 1,743.4 crore at Mar-26. Total equity increased by Rs 110.1 crore to Rs 932.7 crore, while non-current borrowings were nearly unchanged at Rs 147.8 crore versus Rs 147.7 crore.
Got a follow-up? Ask IRIS
How much operating cash did MTAR generate?
MTAR generated net cash from operating activities of Rs 350.0 crore for the period ended 30-Sep-26, compared with Rs 39.8 crore for the period ended 30-Sep-25. Cash generated from operations was Rs 382.4 crore after operating profit before working-capital changes of Rs 187.4 crore and Rs 195.0 crore of working-capital changes. Direct taxes paid, net of refunds, were Rs 32.4 crore.
In the year-earlier period, operating profit before working-capital changes was Rs 47.7 crore and working-capital changes were Rs 0.6 crore. Cash generated from operations was Rs 48.3 crore before Rs 8.5 crore of taxes paid. Net operating cash flow consequently increased by Rs 310.2 crore between the two reported periods.
MTAR’s operating cash inflow was lower than the Rs 407.3 crore net cash used in investing activities during the period ended 30-Sep-26. Financing activities generated Rs 56.6 crore, compared with an outflow of Rs 13.6 crore a year earlier. The net change in cash and cash equivalents was Rs 0.3 crore, versus Rs 2.6 crore in the period ended 30-Sep-25.
What operating performance and order book accompanied the cash flow?
MTAR reported revenue from operations of Rs 767.5 crore in H1FY27, up from Rs 292.2 crore in H1FY26, a year-on-year increase of 162.7%. Earnings before interest, tax, depreciation and amortisation, or EBITDA, increased to Rs 184.2 crore from Rs 45.4 crore. The EBITDA margin rose to 24.0% from 15.5%.
Profit after tax was Rs 110.1 crore in H1FY27, compared with Rs 15.1 crore in H1FY26, while the margin increased to 14.3% from 5.2%. In Q2FY27, revenue was Rs 406.8 crore, compared with Rs 135.6 crore a year earlier, but gross-profit margin declined to 46.8% from 51.2%.
MTAR reported an order book of Rs 5,976.5 crore at 30-Sep-26 after securing Rs 1,207.2 crore of orders during Q2FY27. The order book was Rs 5,143.3 crore at 30-Jun-26, with Rs 374.0 crore of sales restated at order book, excluding foreign-exchange fluctuations, price escalations and scrap sales. Clean Energy, comprising fuel cell, hydel and other orders, represented 67.2% of the Sep-26 order book.
Export revenue represented 78% of H1FY27 revenue and 75% of Q2FY27 revenue, compared with domestic shares of 22% and 25%. MTAR also said it had commenced exports of ball screws to IAI in Products & Others, which reported revenue of Rs 226.3 crore in H1FY27. The presentation does not provide operating cash flow by segment.
Conclusion
MTAR’s reported figures show that total working-capital days fell from 266 at Dec-25 to 50 at Sep-26, contributing Rs 195.0 crore to cash flow from working-capital changes. Net operating cash flow reached Rs 350.0 crore for the period ended 30-Sep-26, alongside lower receivables, higher current liabilities and higher inventories.
The next reported measures to watch are the Rs 5,976.5 crore order book at 30-Sep-26, including Rs 1,207.2 crore of Q2FY27 order intake, and investment activity. Property, plant and equipment plus capital work-in-progress totalled Rs 750.7 crore at Sep-26, while net investing cash outflow was Rs 407.3 crore for the period.