










Narayana Health India hospital margin reached 26.8% in Q2 FY27
Key highlights
- NH India Hospitals’ EBITDA margin rose to 26.8% in Q2 FY27 from 23.8% a year earlier and 24.8% in Q1 FY27.
- India Hospitals revenue increased 16.7% year on year to Rs 143.88 crore in Q2 FY27, including Rs 9.01 crore of international revenue.
- Hospital outpatient footfalls reached 744,000 and discharges reached 60,000 in Q2 FY27, up from 662,000 and 58,000 a year earlier.
- Doctors and nurses costs fell to 26% of operating revenue in Q2 FY27 from 27% a year earlier, while consumables declined to 22% from 23%.
powered by IRIS
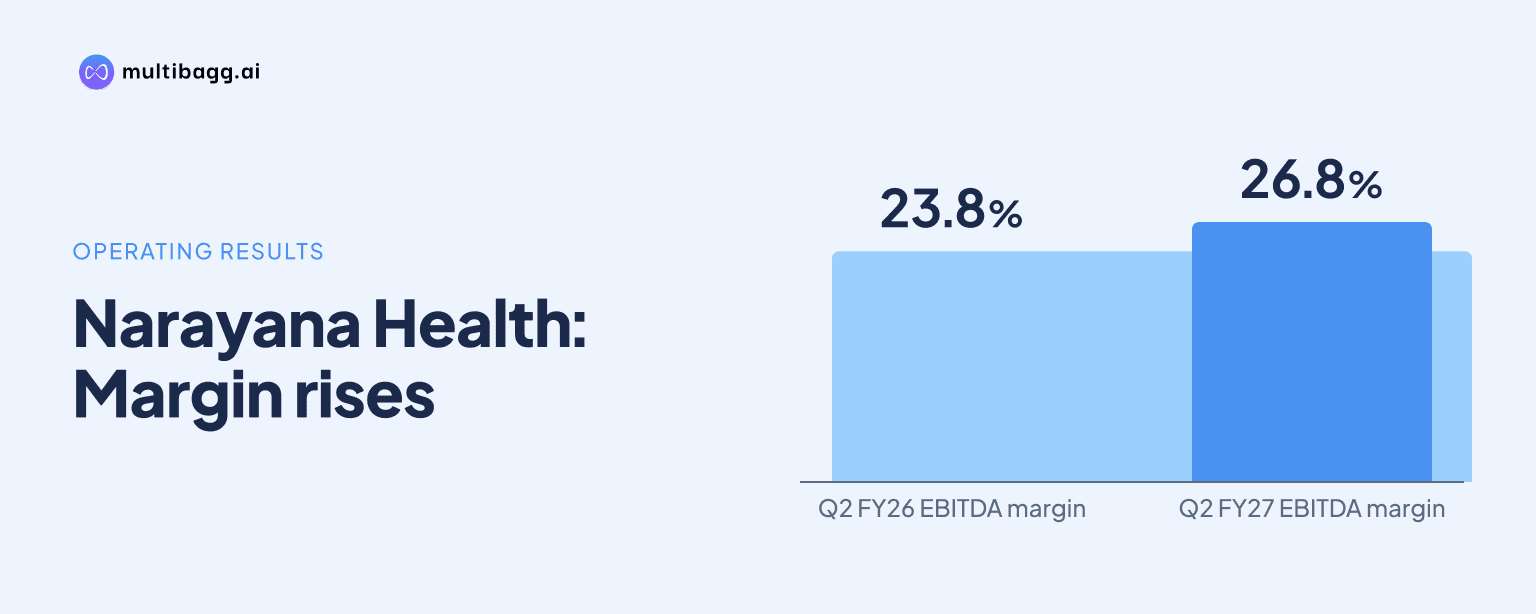
Narayana Health reported a 26.8% earnings before interest, tax, depreciation and amortisation (EBITDA) margin for NH India Hospitals in Q2 FY27, up from 23.8% a year earlier. India revenue increased 16.7% year on year to Rs 143.88 crore, while hospital outpatient footfalls, discharges and revenue per patient also rose.
Know Narayana Hrudayalaya inside out
Results, valuation, peers and who's buying, in one view.
How much did NH India Hospitals’ profitability increase?
NH India Hospitals’ EBITDA margin increased by 3.0 percentage points year on year and 2.0 percentage points sequentially to 26.8% in Q2 FY27. EBITDA reached Rs 37.99 crore, compared with Rs 29.03 crore in Q2 FY26 and Rs 32.29 crore in Q1 FY27. The data cover India Hospitals, while the presentation separately reports a combined India Hospitals and NHIC Clinics margin.
The margin including NHIC Clinics was 26.0% in Q2 FY27, compared with 22.5% in Q2 FY26 and 23.4% in Q1 FY27. NH India’s EBITDA was Rs 35.48 crore in Q2 FY27, equal to a 24.6% margin. Excluding other income, the EBITDA margin for NH India Hospitals was 23.6%, against 23.2% in Q1 FY27 and 22.2% in Q2 FY26.
How did NH India Hospitals revenue change in Q2 FY27?
NH India Hospitals revenue increased to Rs 143.88 crore in Q2 FY27, from Rs 131.96 crore in Q1 FY27 and Rs 123.31 crore in Q2 FY26. That represented 9.0% quarter-on-quarter growth and 16.7% year-on-year growth. The stated total excludes ATHMA and Medha and is adjusted for inter-company eliminations.
Domestic revenue accounted for Rs 134.42 crore in Q2 FY27, comprising Rs 132.56 crore from hospitals and Rs 1.86 crore from clinics. Hospital revenue was Rs 123.81 crore in Q1 FY27 and Rs 117.07 crore in Q2 FY26, showing that hospitals supplied most of the domestic increase. International revenue rose faster, reaching Rs 9.01 crore, up 41.2% from Rs 6.38 crore in Q1 FY27 and 75.7% from Rs 5.13 crore a year earlier.
Did NH India Hospitals treat more patients and earn more per patient?
NH India Hospitals treated more patients in Q2 FY27, with hospital outpatient footfalls rising to 744,000 from 674,000 in Q1 FY27 and 662,000 in Q2 FY26. Clinic outpatient footfalls reached 81,000, compared with 67,000 in the preceding quarter and 64,000 a year earlier. Inpatient footfalls, which correspond to discharges, increased to 60,000 from 57,000 sequentially and 58,000 year on year.
Revenue per patient also increased during the period. Average revenue per outpatient was Rs 5,200 in Q2 FY27, versus Rs 5,100 in Q1 FY27 and Rs 4,800 in Q2 FY26. Average revenue per inpatient was Rs 1.63 lakh, compared with Rs 1.63 lakh sequentially and Rs 1.49 lakh a year earlier. Average revenue per occupied bed, or ARPOB, was Rs 1.95 crore in Q2 FY27, up from Rs 1.75 crore in Q2 FY26.
The average length of stay, or ALOS, remained 4.3 days in all three reported quarters, despite the increase in discharges. Intensive care unit occupied bed days rose to 102,000 in Q2 FY27 from 96,000 in both Q1 FY27 and Q2 FY26. The stable ALOS and higher ICU occupied bed days provide the operating context for the higher inpatient revenue per patient.
Got a follow-up? Ask IRIS
Which NH India Hospitals clusters and revenue streams were largest?
NH India Hospitals’ Bangalore cluster was the largest by hospital operating revenue share in Q2 FY27, contributing 37% with 1,490 capacity beds. Kolkata followed with 26% of hospital operating revenue and 1,453 beds, while the Northern cluster represented 13% with 882 beds. Bangalore recorded the fastest stated year-on-year hospital revenue growth at 18%, compared with 16% for Kolkata and Eastern Peripheral.
Bangalore also reported the highest outpatient average revenue per patient, at Rs 6,100, and the highest inpatient average revenue per patient, at Rs 2.51 lakh. Kolkata’s corresponding figures were Rs 4,600 and Rs 1.69 lakh. Southern Peripheral accounted for 9% of hospital operating revenue despite 800 capacity beds, and reported Rs 4,300 outpatient revenue per patient and Rs 88,000 inpatient revenue per patient.
Owned hospitals generated 74% of operating revenue excluding NHIC, while operated hospitals generated 25% and heart centres and clinic business each contributed 1%. Cardiac sciences were the largest specialty at 33% of revenue, ahead of oncology at 15% and medicine and gastrointestinal sciences at 14%. Domestic walk-in patients represented 43% of the payor profile, insured patients 33%, schemes 18% and international patients 7%.
What changed in NH India Hospitals’ cost structure?
NH India Hospitals reported lower doctors and nurses costs and consumable expenses as percentages of operating revenue in Q2 FY27. Doctors and nurses costs were 26%, down from 28% in Q1 FY27 and 27% in Q2 FY26. Consumable expenses were 22%, versus 23% in both comparison periods. The presentation defines doctors and nurses costs as employee benefits plus professional fees to doctors.
Other manpower cost was 10% in Q2 FY27, down from 11% a year earlier and unchanged from Q1 FY27. Rental or revenue-share costs remained 2% across all three periods. Other expenses increased to 18% in Q2 FY27 from 17% in Q1 FY27 and Q2 FY26; NH India Hospitals defines this line as overhead expenses plus all other expenses.
The cost movements occurred alongside the increase in EBITDA margin from 24.8% in Q1 FY27 to 26.8% in Q2 FY27. The presentation notes that the effect of Indian Accounting Standard, or Ind AS, benefits is not considered in this cost-structure view. It does not assign a specific share of the margin change to volume, pricing, specialty mix or any individual expense line.
Conclusion
NH India Hospitals combined a 16.7% year-on-year rise in India revenue with higher outpatient footfalls, discharges, ICU occupied bed days and revenue per patient in Q2 FY27. Its EBITDA margin reached 26.8%, while doctors and nurses costs and consumable expenses took lower shares of operating revenue than in Q1 FY27 and Q2 FY26.
The next reported comparison will show whether the Q2 FY27 increase is sustained as Banashankari Hospital and Nagarabhavi Clinic begin contributing operating metrics from Q3 FY27. These facilities commenced operations in the last week of September 2026, and their metrics were not included in the Q2 FY27 operating review.