










Nifty 50 Valuation Falls Below Five-Year Average at 17.2x
Key highlights
- Nifty 50 trades at 17.2x 12-month forward earnings versus a 19.2x five-year average.
- Nifty Midcap 150 and Nifty Smallcap 250 were at about 28x and 34x earnings by October 2026.
- MSCI India was at 18.45x forward P/E versus 8.84x for MSCI Asia ex-Japan as of October 30.
- Nifty IT's P/E was about 20 on October 16, 2026, versus about 421 on February 21, 2000.
powered by IRIS
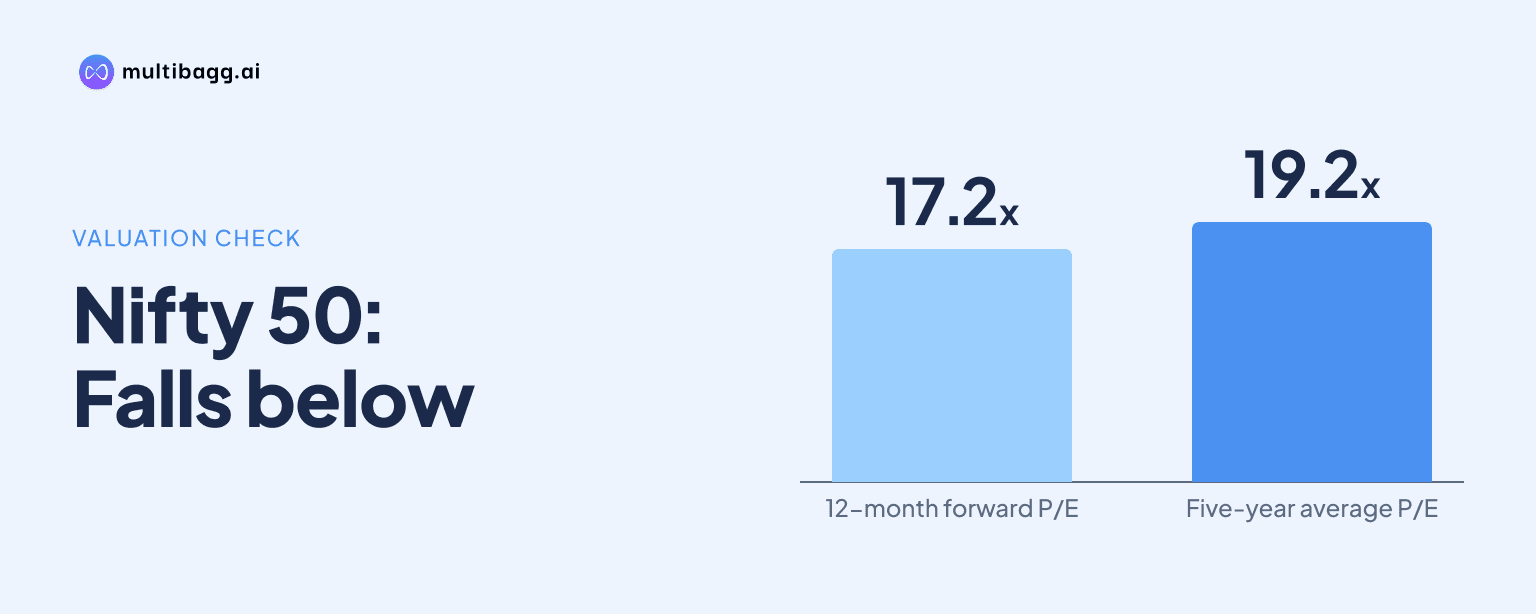
Nifty 50 trades at 17.2 times 12-month forward earnings, compared with its five-year average of 19.2 times, placing the large-cap Indian benchmark below the Nasdaq 100, Dow Jones and Nikkei 225 on this measure. The reading contrasts with higher valuation multiples reported for Indian mid-cap and small-cap indices.
Why is Nifty 50 trading below its five-year valuation average?
Nifty 50 is trading at 17.2 times 12-month forward earnings, which is 2 times below its stated five-year average of 19.2 times. A forward P/E compares an index level with expected earnings over the coming 12 months, making it a commonly used measure for comparing expected valuations across markets.
The context also contains other Nifty 50 P/E readings, reflecting different dates and methodologies. The official Nifty 50 fact sheet dated July 31, 2026 showed a P/E of about 20.78 times, while an October 2026 reference put the index at around 20 times earnings. Those figures should not be treated as directly interchangeable with the 17.2-times 12-month forward P/E, which is a forward-looking comparison.
How does Nifty 50 compare with global equity markets?
Nifty 50 at 17.2 times forward earnings is valued below the Nasdaq 100 at 19.1 times, the Nikkei 225 at 19.5 times and the Dow Jones at 20 times. It remains above the DAX at 15.5 times, the CAC 40 at 13.3 times and Brazil at 7.9 times.
The comparison shows that a lower multiple than its own recent average does not mean Nifty 50 is the least expensive market globally. The DAX and CAC 40 were at or above their listed five-year averages, while the Nasdaq 100 was below its 24.5-times five-year average. Valuation comparisons are most useful when investors distinguish between markets with different earnings expectations, constituent mixes and economic conditions.
Why are mid-cap and small-cap valuations higher than Nifty 50?
Nifty Midcap 150 and Nifty Smallcap 250 were reported at about 28 times and 34 times earnings respectively by October 2026, above Nifty 50 at around 20 times in that comparison. Another forward-earnings comparison placed the Nifty Midcap 100 and Nifty Smallcap indices at 22 times, against 17.2 times for Nifty 50.
The historical path in the available data is also different across market segments. Mid-cap P/E rose to around 45 times in 2024 before declining to around 28, while small-cap P/E was around 33 in September 2024 and stood around 34 later. Nifty 50, by contrast, generally traded around 20-24 times earnings in recent years. These figures indicate that valuation dispersion within Indian equities remains material even as the large-cap benchmark has moved below its five-year forward average.
Got a follow-up? Ask IRIS
What does the MSCI India valuation comparison show?
MSCI India was reported at 18.45 times forward P/E as of October 30, more than twice MSCI Asia ex-Japan at 8.84 times. A separate reference put the dollar-denominated MSCI India Index at around 18.5 times 12-month forward earnings, its lowest level since May 2020, after a record 24.54 times in September 2024.
Other figures in the discussion similarly place India at a premium to broader emerging-market benchmarks. MSCI Emerging Markets was cited at 8.7 times forward earnings in one comparison, while another cited 12.7 times and put MSCI India at 22.3 times. The differing data points underline the importance of checking the valuation date, index currency and whether the multiple is trailing or forward before drawing conclusions.
How is an index P/E ratio calculated?
Nifty 50 P/E is not a simple arithmetic average of the P/E ratios of 50 constituent companies. NSE calculates an index valuation measure by relating the combined market value of index constituents to their combined earnings over the last four quarters, with adjustments for shares included under the index methodology.
That construction matters because larger constituents carry greater influence on the index-level multiple than smaller ones. A P/E also represents a relationship between prices and earnings rather than a forecast of returns. The Nifty IT example in the context illustrates how sharply this relationship can change over time: its P/E was about 421 on February 21, 2000 and about 20 on October 16, 2026.
Conclusion
Nifty 50's 17.2-times forward P/E places it below its five-year average and below several large developed-market indices, while Indian mid-cap and small-cap segments retain higher reported multiples. At the same time, MSCI India continues to trade at a substantial premium to Asia ex-Japan and broader emerging-market measures in the comparisons provided.
Investors should watch subsequent official NSE valuation data and whether the gap between large-cap, mid-cap and small-cap P/E ratios narrows. The available figures also point to an unresolved issue in cross-market comparisons: reported multiples vary with the date, index definition and use of trailing versus forward earnings.