










Nykaa annualised ROCE reaches 27.3% as asset use improves
Key highlights
- Nykaa’s annualised ROCE increased to 27.3% in H1FY27 from 21.2% in FY26.
- Fixed-asset turnover rose to 10.8 times in H1FY27 from 9.9 times in FY26.
- Working-capital days stayed at 28 in H1FY27, versus 42 days in FY24.
- Nykaa spent Rs 62 crore on H1FY27 capex, with stores receiving 46% of the total.
powered by IRIS
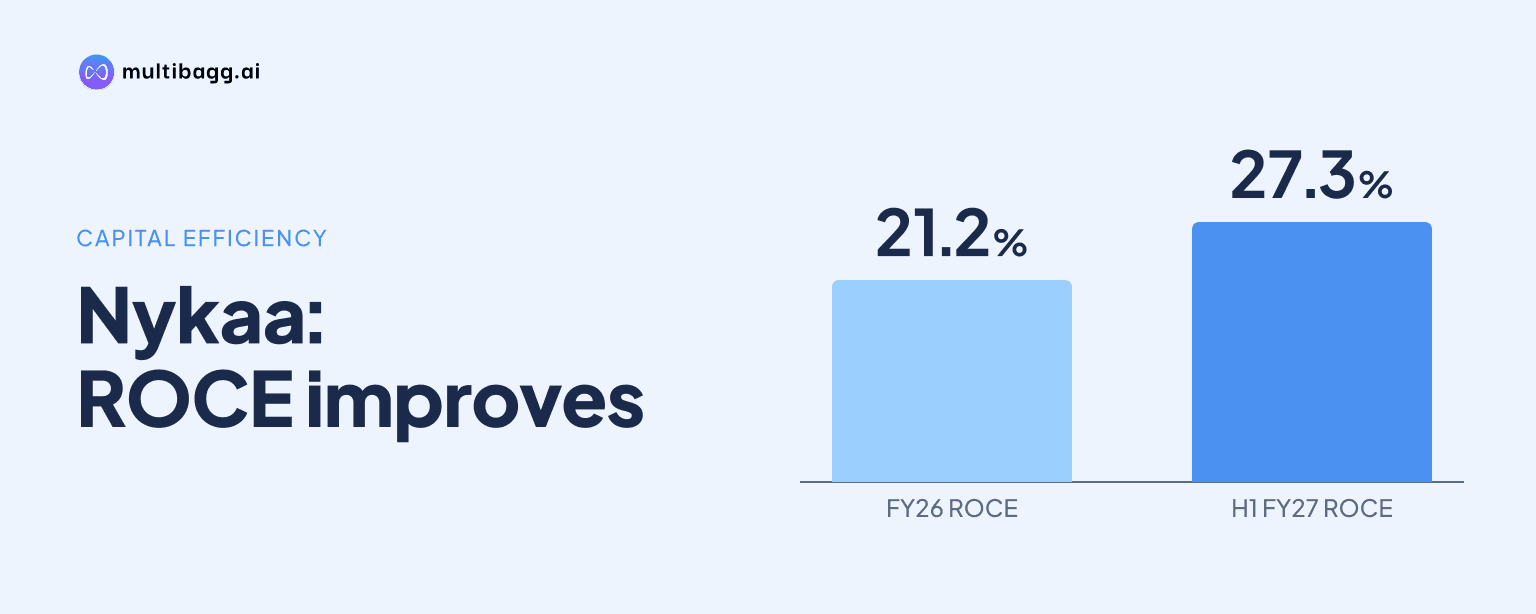
FSN E-Commerce Ventures Limited, referred to as Nykaa, reported annualised return on capital employed (ROCE) of 27.3% in H1FY27, up from 21.2% in FY26, as fixed-asset turnover rose to 10.8 times and working-capital days remained at 28. The presentation links the improvement to higher profitability and capital efficiency.
Know FSN E-Commerce Ventures inside out
Results, valuation, peers and who's buying, in one view.
What drove Nykaa’s annualised ROCE to 27.3%?
Nykaa’s annualised ROCE reached 27.3% in H1FY27, a 6.1-percentage-point increase from 21.2% in FY26 and a 19.8-percentage-point increase from 7.5% in FY24. The H1FY27 figure is annualised, as specified in the presentation, rather than a reported full-year outcome. The measure rose from 7.5% in FY24 to 11.3% in FY25, 21.2% in FY26 and 27.3% in H1FY27.
Nykaa attributes the ROCE trend to improved profitability alongside capital efficiency. In H1FY27, total earnings before interest, tax, depreciation and amortisation (EBITDA) were Rs 499 crore, compared with Rs 300 crore in H1FY26. The EBITDA margin expanded to 8.5% from 6.7%, while revenue from operations increased 29% to Rs 5,788 crore from Rs 4,501 crore. These reported earnings changes accompanied the higher annualised return measure.
How did Nykaa’s fixed-asset turnover change?
Nykaa’s fixed-asset turnover increased to 10.8 times in annualised H1FY27 from 9.9 times in FY26, after remaining at 9.1 times in both FY24 and FY25. The H1FY27 reading was 1.7 times above FY24 and 0.9 times above FY26. This indicator rose while Nykaa continued to allocate capital to stores, warehouses and technology.
Nykaa said the rising salience of asset-light businesses, including Fashion and House of Nykaa, supported the turnover trend. Fashion reported H1FY27 revenue from operations of Rs 540 crore, up 45% from Rs 372 crore in H1FY26, while Beauty generated Rs 5,216 crore, up 27% from Rs 4,107 crore. Fashion grew faster from a smaller revenue base, while total revenue from operations was Rs 5,788 crore for the half year.
The profitability profile differed by vertical in H1FY27. Beauty reported EBITDA of Rs 511 crore and an EBITDA margin of 10.4%, while Fashion reported EBITDA of Rs 1 crore and a 0.1% margin. Nykaa identifies Fashion and House of Nykaa as asset-light businesses relevant to fixed-asset turnover, but the presentation does not provide separate House of Nykaa revenue or EBITDA figures.
Got a follow-up? Ask IRIS
Did Nykaa maintain working-capital efficiency?
Nykaa maintained working-capital days at 28 in H1FY27, unchanged from FY26, after reducing them from 34 in FY25 and 42 in FY24. The 28-day figure was 14 days lower than FY24 and six days lower than FY25. Nykaa describes the result as sustained working-capital efficiency, with no further reduction reported in the H1FY27 annualised comparison.
The stable working-capital result coincided with higher sales activity. Total gross merchandise value (GMV), the monetary value of orders before returns or cancellations, rose 32% year on year to Rs 11,740 crore in H1FY27 from Rs 8,926 crore in H1FY26. Net sales value increased 32% to Rs 5,899 crore from Rs 4,477 crore, while revenue from operations grew 29% to Rs 5,788 crore from Rs 4,501 crore.
Nykaa’s H1FY27 total contribution profit was Rs 1,226 crore, up from Rs 911 crore in H1FY26, and contribution margin increased to 20.8% of net sales value from 20.3%. Fulfilment expense represented 9.8% of net sales value, versus 9.6% a year earlier, whereas marketing and selling and distribution expense declined to 14.4% from 15.1%. Those operating ratios provide the earnings context for unchanged 28 working-capital days.
Where did Nykaa allocate H1FY27 capital expenditure?
Nykaa spent Rs 62 crore on capital expenditure, or capex, in H1FY27, equal to 1% of revenue. Stores accounted for 46% of the total, technology for 30% and warehouses for 24%. The largest disclosed share was directed to retail expansion, while warehouse spending addressed fulfilment capabilities and technology received nearly one-third of H1FY27 capex.
The H1FY27 capex total of Rs 62 crore compares with Rs 145 crore in FY26, Rs 128 crore in FY25 and Rs 115 crore in FY24, although H1FY27 is a half-year period and the earlier figures are full years. Capex as a percentage of revenue was 2% in FY24 and FY25, then 1% in FY26 and H1FY27. Nykaa characterises this pattern as year-on-year capex optimisation while continuing investment in retail expansion, fulfilment capabilities and technology.
Nykaa also cited infrastructure investment intended to improve order-to-delivery days. In Q2FY27, fulfilment expense was Rs 304 crore, up from Rs 227 crore in Q2FY26, and represented 10.1% of revenue from operations compared with 9.7% a year earlier. On a net sales value basis, Q2FY27 fulfilment expense was 9.9% for Beauty and 10.3% for Fashion, compared with 9.5% and 11.2%, respectively, in Q2FY26.
Conclusion
Together, the figures show that Nykaa combined a rise in annualised ROCE from 21.2% in FY26 to 27.3% in H1FY27 with fixed-asset turnover of 10.8 times and working-capital days held at 28. H1FY27 EBITDA increased to Rs 499 crore from Rs 300 crore and its margin rose to 8.5% from 6.7%, matching Nykaa’s stated profitability and capital-efficiency drivers.
The next reporting periods will show whether Nykaa can maintain 28 working-capital days while executing its disclosed investment priorities of retail expansion, fulfilment capabilities and technology. They will also indicate whether the Rs 62 crore H1FY27 capex mix, led by stores at 46%, continues to coincide with higher fixed-asset turnover and whether the annualised 27.3% ROCE converts into a full-year result.