










Orient H1 FY27 revenue fell 14.25% as EBITDA declined year on year
Key highlights
- Orient’s standalone H1 FY27 revenue was Rs 418.982 crore, down 14.25% year on year.
- Standalone H1 FY27 EBITDA declined 9.21% to Rs 35.673 crore.
- Orient reported an H1 FY27 EBITDA margin of 8.51%.
- The presentation stated a standalone Q2 FY27 EBITDA margin of 9.66%, but its quarterly tables use Q2 FY26 labels.
powered by IRIS
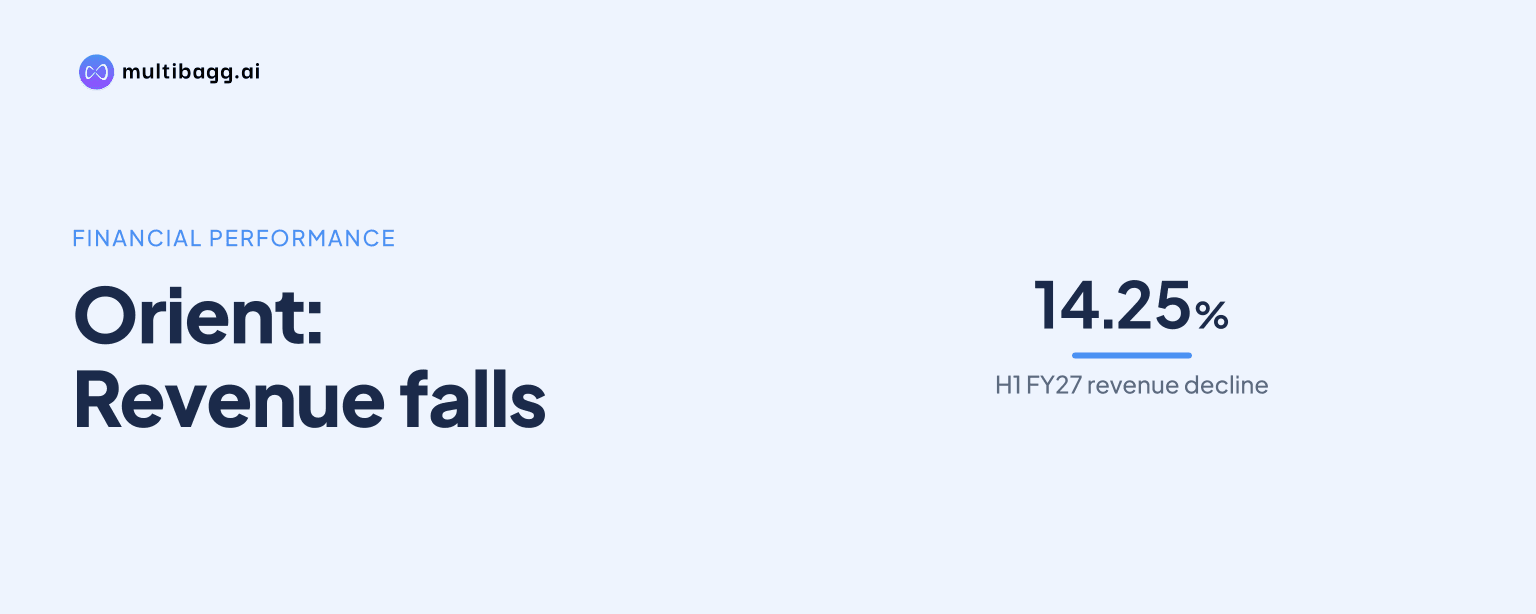
Orient reported standalone H1 FY27 revenue of Rs 418.982 crore, down 14.25% from H1 FY26, while earnings before interest, taxes, depreciation and amortisation (EBITDA) declined 9.21% to Rs 35.673 crore. The presentation stated an 8.51% H1 EBITDA margin and a separately stated 9.66% margin for Q2 FY27.
Know Orient Technologies inside out
Results, valuation, peers and who's buying, in one view.
How did Orient perform in H1 FY27?
Orient’s standalone revenue fell to Rs 418.982 crore in H1 FY27 from Rs 488.603 crore in H1 FY26, reversing the 30.51% growth reported for H1 FY26. The H1 FY27 result followed revenue growth of 39.61% in H1 FY25, when revenue reached Rs 374.383 crore from Rs 268.166 crore in H1 FY24.
Despite the year-on-year decline, H1 FY27 revenue remained Rs 44.599 crore above the Rs 374.383 crore reported in H1 FY25. It was, however, Rs 69.621 crore below H1 FY26, making the latest first-half period the first decline in the four-period standalone revenue series shown in the presentation.
What changed in Orient’s H1 profitability?
Orient’s gross profit decreased 3.43% year on year to Rs 78.722 crore in H1 FY27, while EBITDA decreased 9.21% to Rs 35.673 crore. Revenue declined by 14.25%, a larger reported percentage fall than gross profit but a smaller fall than EBITDA, and the presentation reported an H1 FY27 EBITDA margin of 8.51%.
The comparison with earlier first-half periods shows that gross profit had increased 21.30% to Rs 81.522 crore in H1 FY26 from Rs 67.207 crore in H1 FY25. EBITDA rose 14.31% to Rs 39.290 crore in H1 FY26 after declining 27.65% to Rs 34.370 crore in H1 FY25, before both measures moved lower in H1 FY27.
H1 FY27 gross profit and EBITDA nevertheless remained above the H1 FY25 amounts of Rs 67.207 crore and Rs 34.370 crore, respectively. The presentation does not provide H1 EBITDA-margin figures for FY26 or FY25, so it supports comparison of reported amounts and growth rates, but not a direct year-on-year comparison of first-half margins.
Got a follow-up? Ask IRIS
What does Orient disclose about quarterly momentum?
Orient stated that standalone EBITDA margin was 9.66% in Q2 FY27, 1.15 percentage points above the 8.51% stated for H1 FY27. However, the quarterly tables on the same page label their later periods as Q1 FY26 and Q2 FY26, so the presentation does not provide a fully aligned quarterly fiscal-year labelling set.
In the standalone revenue table, the figure labelled Q1 FY26 was Rs 201.342 crore and the Q2 FY26 figure was Rs 217.640 crore, an increase of Rs 16.298 crore. The page reports revenue growth of 8.09% for that latter interval, while the preceding entry is labelled Q4 FY24 at Rs 182.742 crore.
The gross-profit table shows Rs 35.827 crore for Q1 FY26 and Rs 42.895 crore for Q2 FY26, with reported growth of 19.73%. The EBITDA table shows Rs 14.656 crore and Rs 21.016 crore for those same labels, respectively, and reports 43.39% growth, while its first entry is labelled Q4 FY26 at Rs 5.217 crore.
How do Orient’s standalone and consolidated quarterly figures compare?
Orient’s displayed consolidated Q2 FY26 revenue was Rs 220.059 crore, compared with Rs 217.640 crore in the standalone table’s Q2 FY26 column. Consolidated EBITDA was Rs 22.450 crore versus Rs 21.016 crore in the standalone table, although the standalone page separately captions its 9.66% margin as Q2 FY27.
The consolidated table records revenue of Rs 203.772 crore in Q1 FY26 and Rs 220.059 crore in Q2 FY26, with 7.99% growth stated for the latter interval. Gross profit increased from Rs 37.718 crore to Rs 45.590 crore, and EBITDA rose from Rs 15.420 crore to Rs 22.450 crore, with reported growth of 20.87% and 45.59%, respectively.
The presentation states a consolidated EBITDA margin of 10.20% in Q2 FY26, while it states a standalone EBITDA margin of 9.66% in Q2 FY27. Those captions identify different fiscal periods, so the two margin figures should not be treated as a confirmed like-for-like standalone-versus-consolidated comparison based on the supplied pages.
Conclusion
Orient’s first-half record shows a reversal in the revenue and earnings trend recorded in H1 FY26: H1 FY27 gross profit fell 3.43% to Rs 78.722 crore and EBITDA fell 9.21% to Rs 35.673 crore. The stated 9.66% standalone Q2 FY27 margin was higher than the 8.51% H1 margin, while the tables labelled Q1 FY26 and Q2 FY26 show increases in revenue, gross profit and EBITDA.
The key unresolved matter to watch is the presentation’s period labelling. Its standalone page combines Q2 FY26 table columns with a stated Q2 FY27 EBITDA margin of 9.66%, while the consolidated page states a Q2 FY26 margin of 10.20%; clearer period identification would determine whether the margins and quarterly figures can be compared directly.