










Page Industries grew FY22-26 revenue 35% to Rs 5,246.8 crore
Key highlights
- Page Industries revenue increased 35% from Rs 3,886.5 crore in FY22 to Rs 5,246.8 crore in FY26.
- FY26 EBITDA was Rs 1,152.9 crore and the EBITDA margin was 22.0%, versus 20.2% in FY22.
- FY26 ROCE reached 74%, up from 51% in FY24 and 68% in FY22.
- Net working-capital days were 56 in FY26, compared with 75 in FY24 and 54 in FY25.
powered by IRIS
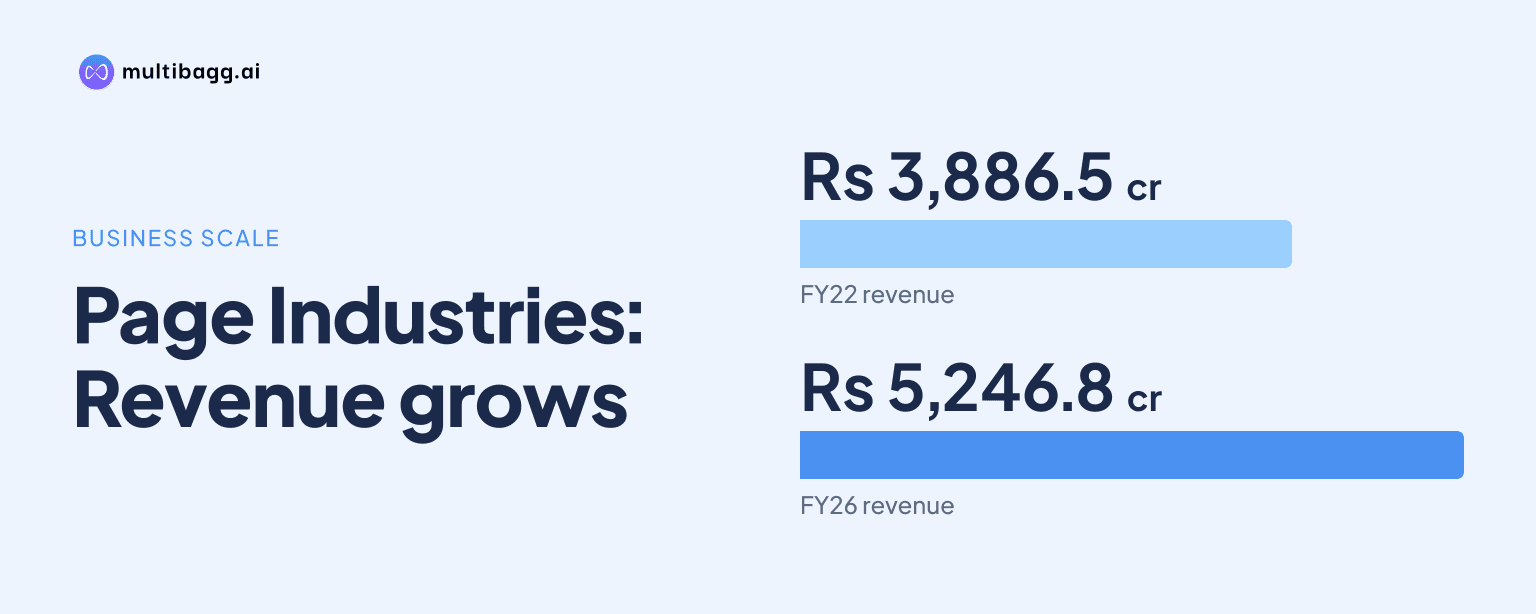
Page Industries increased FY22-26 revenue 35% to Rs 5,246.8 crore, while its FY26 EBITDA margin reached 22.0% and return on capital employed reached 74%. The five-year record includes a revenue decline to Rs 4,569.2 crore in FY24, followed by two years of expansion and a recovery in reported operating and capital-return metrics.
Know Page Industries inside out
Results, valuation, peers and who's buying, in one view.
How did Page Industries revenue change from FY22 to FY26?
Page Industries increased revenue by Rs 1,360.3 crore from Rs 3,886.5 crore in FY22 to Rs 5,246.8 crore in FY26. The 35% rise across the five-year period followed an uneven path: revenue climbed to Rs 4,714.2 crore in FY23, declined to Rs 4,569.2 crore in FY24, and then exceeded its prior peak in FY25.
The FY24 decline was Rs 145 crore from FY23, before revenue rose Rs 365.7 crore to Rs 4,934.9 crore in FY25 and a further Rs 311.9 crore in FY26. FY26 revenue was therefore Rs 311.9 crore above FY25 and Rs 532.6 crore above the FY23 level, according to the financial-performance record.
The presentation links its growth approach to reaching new consumers, premiumisation and increasing consumption per consumer. Its stated mechanisms include expanding physical touchpoints, investing in retail and digital spaces, data-backed merchandising at points of sale, and continuous product innovation alongside the FY22-FY26 revenue progression from Rs 3,886.5 crore to Rs 5,246.8 crore.
How did Page Industries profitability change over five years?
Page Industries reported FY26 earnings before interest, tax, depreciation and amortisation (EBITDA) of Rs 1,152.9 crore, with an EBITDA margin of 22.0%, up from Rs 785.5 crore and a 20.2% margin in FY22. EBITDA grew by Rs 367.4 crore over the period, while the reported margin increased by 1.8 percentage points.
The margin did not move steadily. EBITDA margin fell to 18.3% in FY23, its low point in the five displayed years, before increasing to 18.8% in FY24, 21.5% in FY25 and 22.0% in FY26. EBITDA was broadly flat between FY23 at Rs 862.7 crore and FY24 at Rs 859.8 crore, then rose by Rs 202.7 crore in FY25.
Profit after tax (PAT) reached Rs 763.8 crore in FY26, compared with Rs 536.5 crore in FY22. The FY26 PAT margin was 14.6%, below the 14.8% reported in FY25 despite PAT increasing by Rs 34.7 crore from Rs 729.1 crore, meaning the latest year’s absolute profit growth did not produce a higher PAT margin.
Got a follow-up? Ask IRIS
What happened to Page Industries returns on capital and net worth?
Page Industries reported return on capital employed (ROCE) of 74% in FY26, compared with 68% in FY22 and 51% in FY24. ROCE therefore rose 6 percentage points over five years and 23 percentage points from FY24, after reaching 73% in FY25.
Return on net worth (RONW) was 53% in FY26, close to the 54% recorded in FY22 but above the 38% reported in FY24. The series shows RONW declining from 54% in FY22 to 46% in FY23 and 38% in FY24, then recovering to 49% in FY25 and 53% in FY26.
The FY26 outcomes place the two return measures 21 percentage points apart, with ROCE at 74% and RONW at 53%. The presentation says Page Industries is investing for the future through internal accruals while generating ROCE, but it does not provide a numerical ROCE target beyond the FY26 reported figure.
How did Page Industries manage working capital and shareholder distributions?
Page Industries reported net working-capital days of 56 in FY26, compared with 59 in FY22, 75 in FY24 and 54 in FY25. The FY26 position was 3 days lower than FY22 and 19 days below the FY24 peak, although it increased by 2 days from FY25.
Inventory days were 73 in FY26, rising from 64 in FY25 but below 92 in FY22 and 124 in FY23. Receivable days ended at 14 in both FY25 and FY26, versus 16 in FY22, while payable days rose to 22 in FY26 from 19 in FY25 and matched the FY23 level.
Earnings per share were Rs 685 in FY26, up from Rs 654 in FY25 and Rs 481 in FY22. Dividend per share was Rs 550 in FY26, down from Rs 900 in FY25 but above Rs 300 in FY22; the presentation provides the per-share figures without explaining the year-to-year change in dividend per share.
Conclusion
Page Industries’ FY22-FY26 record shows revenue rising from Rs 3,886.5 crore to Rs 5,246.8 crore despite the FY24 interruption, alongside EBITDA margin increasing from 20.2% to 22.0%. ROCE advanced from 68% to 74%, while net working-capital days moved from 59 to 56, combining the reported sales and profitability recovery with higher reported capital returns.
The next disclosed benchmark is Page Industries’ FY28-29 sustainable-revenue target of Rs 8,000 crore, compared with Rs 4,934 crore stated under FY25 economic-performance outcomes. The pace of revenue growth from the FY26 base of Rs 5,246.8 crore, the durability of the 22.0% EBITDA margin, and net working-capital days near the FY25-FY26 range of 54 to 56 days are the disclosed measures to watch next.