










PDS moves to Rs 154 crore net cash on 30 September 2026
Key highlights
- PDS reported net cash of Rs 154 crore at 30 September 2026, compared with net debt of Rs 105 crore at 31 March 2026.
- Total debt fell Rs 81 crore to Rs 1,060 crore, while cash and bank balances increased Rs 178 crore to Rs 1,214 crore.
- PDS reduced NWC days from 4 at 31 March 2026 to negative 5 at 30 September 2026.
- PDS generated Rs 457 crore of operating cash flow in H1 FY27 and reported ROCE of 22%.
powered by IRIS
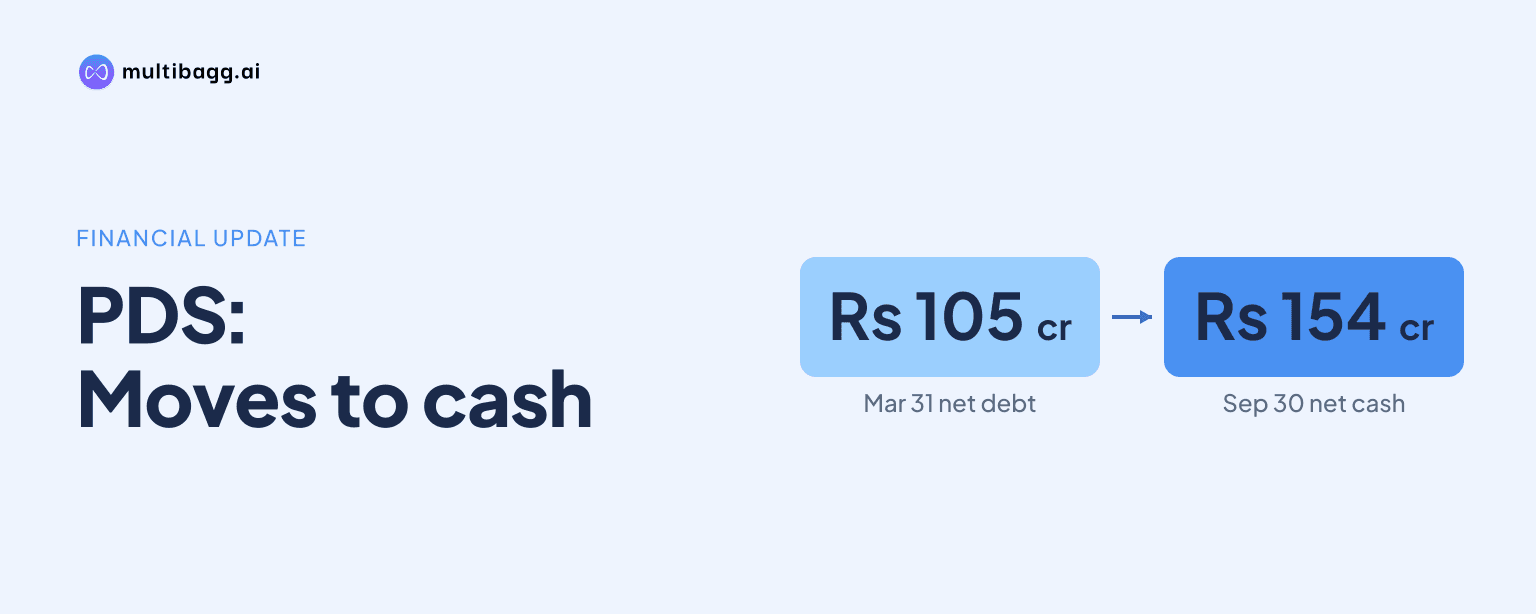
PDS Limited reported net cash of Rs 154 crore at 30 September 2026, reversing net debt of Rs 105 crore at 31 March 2026, as total debt fell Rs 81 crore and cash and bank balances increased Rs 178 crore. Net working capital (NWC) days also moved from 4 to negative 5.
Know PDS inside out
Results, valuation, peers and who's buying, in one view.
How did PDS move into a net-cash position?
PDS moved into a net-cash position because cash and bank balances of Rs 1,214 crore exceeded total debt of Rs 1,060 crore at 30 September 2026. Six months earlier, cash and bank balances of Rs 1,036 crore were below total debt of Rs 1,141 crore, resulting in net debt of Rs 105 crore.
The shift represented a Rs 259 crore improvement in the net debt position between 31 March 2026 and 30 September 2026. Cash and bank balances rose Rs 178 crore, while total debt declined Rs 81 crore. The balance-sheet presentation describes the September position as negative net debt, which denotes net cash.
PDS reduced short-term borrowings by Rs 48 crore to Rs 939 crore and long-term borrowings by Rs 33 crore to Rs 121 crore. These two movements account for the Rs 81 crore decline in total debt, while total equity increased Rs 35 crore to Rs 1,894 crore.
What changed in PDS working-capital days?
PDS reduced NWC days by nine days, from 4 at 31 March 2026 to negative 5 at 30 September 2026. The presentation states that working-capital calculations are based on trailing 12-month figures, rather than solely on the closing balances reported at each date.
The reported NWC result reflected inventory days declining by five days to 15, debtor days declining by one day to 45, and payable days increasing by six days to 67. Payable days were therefore seven days above the combined 60 days for inventory and debtors at 30 September 2026.
Inventories decreased Rs 38 crore to Rs 519 crore, while trade receivables increased Rs 141 crore to Rs 1,788 crore. Trade payables rose Rs 373 crore to Rs 2,113 crore, exceeding the combined Rs 103 crore increase in inventories and receivables. The presentation’s day measures capture the reported trailing-12-month working-capital cycle.
Which balance-sheet lines changed most at PDS?
PDS reported total assets of Rs 5,655 crore at 30 September 2026, up Rs 389 crore from Rs 5,266 crore at 31 March 2026. Current assets increased Rs 417 crore to Rs 4,190 crore, while non-current assets declined Rs 27 crore to Rs 1,465 crore.
Within current assets, cash and bank balances increased Rs 178 crore, trade receivables rose Rs 141 crore and other current assets rose Rs 135 crore to Rs 669 crore. These increases more than offset the Rs 38 crore reduction in inventories, leaving current assets Rs 417 crore higher over the six-month period.
Current liabilities increased Rs 393 crore to Rs 3,541 crore, led by the Rs 373 crore increase in trade payables. Other current liabilities rose Rs 67 crore to Rs 489 crore, while short-term borrowings fell Rs 48 crore. Non-current liabilities declined Rs 39 crore to Rs 219 crore, including the Rs 33 crore decrease in long-term borrowings.
Got a follow-up? Ask IRIS
How did cash flow support the PDS balance-sheet movement?
PDS generated Rs 457 crore of cash flow from operating activities in H1 FY27, compared with Rs 593 crore in H1 FY26. Profit before tax increased to Rs 118 crore from Rs 83 crore, while the cash-flow contribution from changes in net current assets and others decreased to Rs 187 crore from Rs 386 crore.
Investing activities used Rs 38 crore in H1 FY27, compared with Rs 82 crore in H1 FY26. The H1 FY27 outflow included Rs 28 crore of capital expenditure, Rs 12 crore of net investment in bank deposits and Rs 6 crore invested in joint ventures, subsidiaries and others; interest and dividends received were Rs 8 crore.
Financing activities used Rs 215 crore in H1 FY27, against Rs 301 crore a year earlier. Net proceeds from borrowings were negative Rs 58 crore, interest paid was Rs 78 crore, and dividend payments totalled Rs 50 crore, comprising Rs 23 crore to equity shareholders and Rs 27 crore to non-controlling interests.
PDS reported a Rs 204 crore increase in cash and cash equivalents during H1 FY27, ending at Rs 926 crore versus Rs 654 crore at 30 September 2025. This cash-flow line differs from the Rs 1,214 crore balance-sheet line for cash and bank balances at 30 September 2026, which is the measure used in the reported net-cash calculation.
What return and capital-employed measures did PDS report?
PDS reported return on capital employed (ROCE) of 22%, based on net capital employed and trailing-12-month numbers. Management also reported ROCE of 28% after adjusting for new verticals. Consolidated gross capital employed was Rs 2,954 crore and net capital employed was Rs 1,740 crore in H1 FY27.
Sourcing represented Rs 1,527 crore, or 52%, of gross capital employed and generated Rs 7,542 crore of H1 FY27 revenue. Manufacturing represented Rs 900 crore, or 30%, and generated Rs 452 crore of revenue. PDS Ventures and others represented Rs 527 crore, or 18%, and recorded an earnings before interest and tax loss of Rs 4.9 crore.
PDS reported consolidated H1 FY27 revenue of Rs 7,876 crore, up 23% year on year, and earnings before interest and tax of Rs 193 crore at a 2.4% margin. Sourcing generated earnings before interest and tax of Rs 175 crore at a 2.3% margin, compared with manufacturing’s Rs 26 crore at a 5.8% margin.
Conclusion
PDS combined a Rs 178 crore increase in cash and bank balances with an Rs 81 crore reduction in debt to move from Rs 105 crore of net debt to Rs 154 crore of net cash by 30 September 2026. The change coincided with negative 5 NWC days, supported by lower inventory days and higher payable days, while H1 FY27 operating cash flow was Rs 457 crore.
The presentation does not disclose a future net-debt or NWC-days target. The next balance-sheet disclosure will therefore show whether PDS can maintain the reported mix of 15 inventory days, 45 debtor days and 67 payable days, alongside total debt of Rs 1,060 crore and the cash generation reported in H1 FY27.