










PDS Top 10 Verticals Grow 13%, While Margin Edges Down
Key highlights
- PDS’s top 10 sourcing verticals generated $617.7 million of H1 FY27 revenue, up 13.2% year on year.
- The top-10 vertical PBT margin was 4.3% in H1 FY27, compared with 4.4% in H1 FY26.
- Design CoE revenue rose 87.6% to $33.3 million and PBT turned to a $0.8 million profit.
- TECHNO design reported a $1.9 million PBT loss and a negative 5.8% margin in H1 FY27.
powered by IRIS
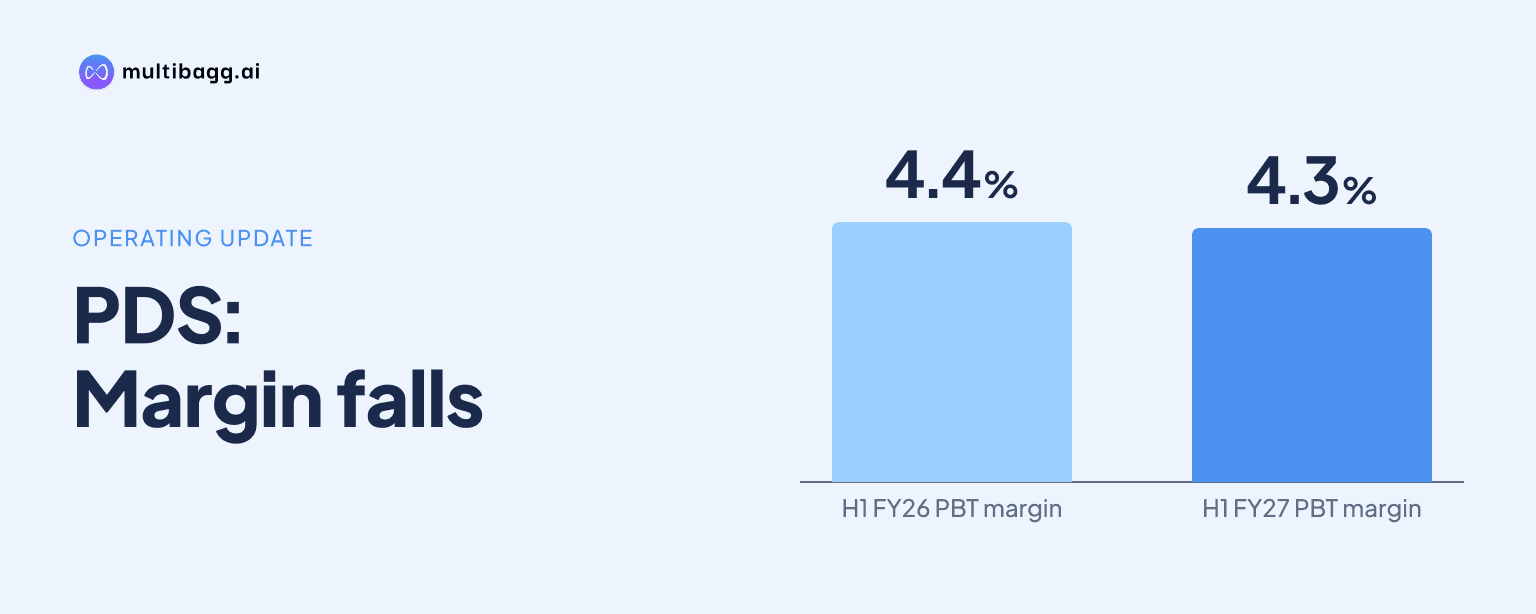
PDS Limited’s top 10 sourcing verticals increased revenue 13.2% year on year to $617.7 million in the first half of financial year 2027 (H1 FY27), while their combined profit before tax margin declined to 4.3% from 4.4% as results varied sharply between individual businesses.
Know PDS inside out
Results, valuation, peers and who's buying, in one view.
How did PDS’s top 10 sourcing verticals perform in H1 FY27?
PDS’s top 10 sourcing verticals generated $617.7 million of revenue in H1 FY27, compared with $545.7 million in H1 FY26, and accounted for more than about 75% of total topline. Profit before tax, or PBT, rose 12.6% to $26.7 million from $23.7 million, broadly matching the 13.2% revenue increase but leaving the aggregate margin 10 basis points lower at 4.3%.
The aggregate result conceals a wide range of outcomes among the 10 businesses. Revenue growth ranged from an 87.6% increase at Design CoE to a 13.3% decline at TECHNO design, while PBT margins in H1 FY27 ranged from negative 5.8% at TECHNO design to 9.5% at Zamira. The vertical figures are based on management accounts and remain subject to regrouping.
Which PDS verticals increased both revenue and PBT?
Simple Approach, Design CoE and Zamira each expanded revenue and PBT in H1 FY27. Simple Approach’s revenue rose 14.9% to $138.7 million and PBT increased 26.8% to $6.2 million, raising its PBT margin to 4.5% from 4.1% in H1 FY26. It was the second-largest disclosed vertical by revenue after Poeticgem.
Design CoE recorded the fastest disclosed revenue growth, with sales rising 87.6% to $33.3 million from $17.8 million. Its PBT moved to a profit of $0.8 million from a loss of $0.8 million, and its margin turned positive to 2.5% from negative 4.4%. PDS also states that Kohl’s business shifted from Zamira to Design CoE, a disclosed regrouping factor relevant to interpreting the two verticals’ reported growth.
Zamira increased revenue by 42.3% to $30.4 million and increased PBT by 313.9% to $2.9 million. Its PBT margin rose to 9.5% from 3.3%, the highest among the named verticals in the presentation. An unnamed US vertical, shown separately in the table, reported 4.5% revenue growth to $28.8 million and a 6.3% margin, up from 6.0%.
Where did PDS revenue growth not translate into higher profit?
Spring’s revenue increased 36.4% to $64.7 million in H1 FY27, but its PBT fell 37.2% to $1.6 million from $2.5 million. Consequently, Spring’s PBT margin declined to 2.4% from 5.3%. The business is identified as UK-based with a Turkey-focused sourcing country, and PDS says Spring Near East excludes intracompany transactions.
Poeticgem remained the largest named vertical, but its profit performance differed from its revenue trend. Revenue grew 5.6% to $163.5 million, while PBT declined 17.2% to $8.4 million from $10.2 million; margin therefore decreased to 5.2% from 6.6%. PDS says Design Arc business has been clubbed with Poeticgem in both periods, preserving the stated year-on-year comparison on that basis.
KRYONS increased revenue 11.7% to $48.9 million but reported PBT of $3.1 million, down 2.1% year on year, as margin decreased to 6.3% from 7.2%. NORLANKA showed declines on both measures, with revenue down 8.7% to $45.4 million and PBT down 14.9% to $1.8 million. Its margin fell 30 basis points to 3.9%.
Got a follow-up? Ask IRIS
Which PDS verticals reported losses or turnarounds?
TECHNO design was the only named vertical reporting a PBT loss in both periods, with the loss widening to $1.9 million in H1 FY27 from $0.7 million in H1 FY26. Revenue decreased 13.3% to $33.2 million, while PBT margin moved to negative 5.8% from negative 1.7%. The presentation identifies its key country as the European Union, or EU.
By contrast, an unnamed EU vertical with China-focused sourcing reported revenue growth of 26.9% to $30.8 million and PBT of $2.0 million, compared with a PBT loss of $0.02 million a year earlier. Its margin changed to 6.5% from negative 0.1%. Because the supplied table does not display this vertical’s name, the presentation does not permit a business-specific explanation beyond its reported geography and sourcing focus.
The contrast between the $2.0 million turnaround in that unnamed vertical and TECHNO design’s $1.9 million loss shows why the total top-10 margin was nearly unchanged despite revenue expansion. The top-10 total margin of 4.3% was below the 4.4% reported in H1 FY26, even as revenue increased by $72.0 million.
How do PDS vertical trends compare with consolidated sourcing performance?
PDS’s sourcing segment reported H1 FY27 revenue of Rs 7,542 crore, up 25% year on year, and earnings before interest and tax, or EBIT, including other income of Rs 175 crore. Its EBIT margin was 2.3%, while sourcing represented 52% of consolidated gross capital employed of Rs 2,954 crore. The top-10 vertical data are reported in US dollars and use PBT, so the two profitability measures are not directly interchangeable.
At the consolidated level, PDS reported revenue of Rs 7,876 crore for H1 FY27, up 23% year on year, and EBIT including other income of Rs 193 crore, for a 2.4% margin. Manufacturing revenue was Rs 452 crore, down 1%, but manufacturing EBIT was Rs 26 crore and its margin was 5.8%. This segment comparison shows that sourcing supplied most reported revenue growth, while manufacturing had a higher stated EBIT margin.
PDS reported consolidated profit after tax of Rs 98 crore in H1 FY27, up 43.8% from Rs 68 crore, with the profit after tax margin improving to 1.3% from 1.1%. Consolidated PBT rose 42.7% to Rs 118 crore, compared with a 12.6% increase in the top-10 vertical PBT measure. The presentation identifies different scopes and reporting bases, including management accounts and exclusions for the vertical table.
Conclusion
PDS’s H1 FY27 top-10 vertical results show 13.2% revenue growth to $617.7 million, but not a uniform earnings outcome. Simple Approach, Design CoE and Zamira increased both sales and PBT, while Spring and Poeticgem expanded revenue with lower profit, and TECHNO design’s loss widened. These differences left the combined PBT margin at 4.3%, slightly below the prior-year 4.4%.
The next management-account comparison will show whether Design CoE’s 87.6% revenue growth continues after the disclosed transfer of Kohl’s business from Zamira and whether TECHNO design can reverse its negative 5.8% margin. The presentation also leaves the reported top-10 mix subject to regrouping and excludes the impact of new verticals of existing businesses, which remain relevant to future comparisons.