










PDS Q2 revenue reaches Rs 4,432 crore as profit after tax rises 44%
Key highlights
- PDS Q2 FY27 revenue was Rs 4,432 crore, up 29.6% year on year.
- PDS Q2 FY27 EBITDA rose 48.7% to Rs 153 crore, and EBITDA margin reached 3.5%.
- PDS Q2 FY27 profit after tax increased 44.2% to Rs 70 crore and its margin reached 1.6%.
- PDS moved from net debt of Rs 105 crore in March 2026 to net cash of Rs 154 crore in September 2026.
powered by IRIS
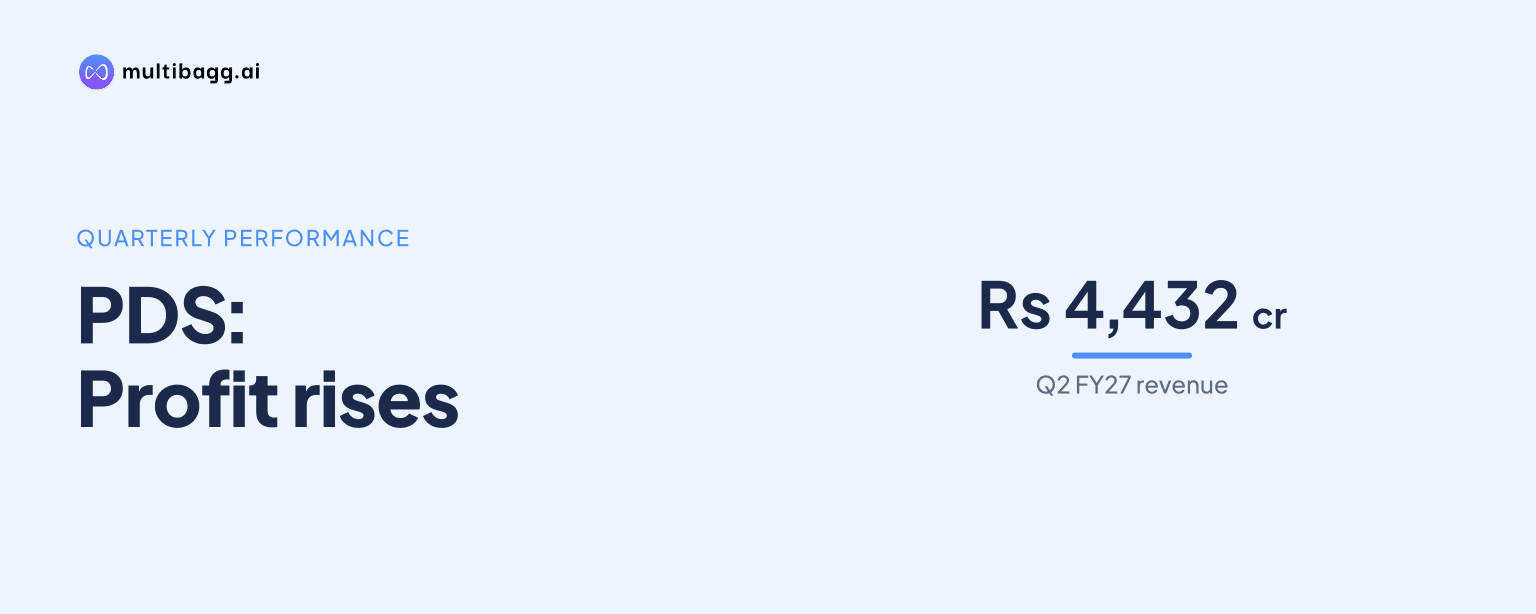
PDS Limited reported income from operations of Rs 4,432 crore in Q2 FY27, the quarter ended September 30, 2026, up 29.6% year on year, while profit after tax rose 44.2% to Rs 70 crore. Earnings before interest, tax, depreciation and amortisation (EBITDA) increased 48.7% to Rs 153 crore and its margin reached 3.5%.
Know PDS inside out
Results, valuation, peers and who's buying, in one view.
How did PDS perform in Q2 FY27?
PDS delivered Rs 4,432 crore of income from operations in Q2 FY27, compared with Rs 3,419 crore a year earlier and Rs 3,444 crore in Q1 FY27. Revenue therefore increased 29.6% year on year and 28.7% quarter on quarter. The presentation provides comparisons with Q2 FY26 and Q1 FY27, but does not provide a longer quarterly series to establish whether the revenue was a record.
Cost of goods sold was Rs 3,544 crore in Q2 FY27, up from Rs 2,739 crore in Q2 FY26, resulting in gross profit of Rs 889 crore versus Rs 680 crore. Gross margin was 20.0%, compared with 19.9% a year earlier and 20.0% in Q1 FY27. Employee expenses rose to Rs 396 crore from Rs 312 crore, while other expenses increased to Rs 340 crore from Rs 266 crore.
Why did PDS EBITDA and profit after tax grow faster than revenue?
PDS grew EBITDA faster than revenue because EBITDA rose 48.7% year on year to Rs 153 crore, against revenue growth of 29.6%. Gross profit increased by Rs 209 crore to Rs 889 crore, while EBITDA increased by Rs 50 crore. EBITDA margin expanded by 44 basis points to 3.5% from 3.0% in Q2 FY26, and by 66 basis points from 2.8% in Q1 FY27.
Profit before tax rose 50.0% year on year to Rs 84 crore from Rs 56 crore, despite other income declining to Rs 10 crore from Rs 27 crore. Finance costs decreased 4.9% to Rs 41 crore, while depreciation increased 23.4% to Rs 40 crore and tax expense rose to Rs 14 crore from Rs 7 crore. Profit after tax was Rs 70 crore, lifting its margin by 16 basis points to 1.6% from 1.4%.
What does PDS's first-half performance show?
PDS generated Rs 7,876 crore of income from operations in H1 FY27, 22.7% above Rs 6,419 crore in H1 FY26, while profit after tax increased 43.8% to Rs 98 crore. H1 FY27 EBITDA rose 62.3% to Rs 249 crore from Rs 154 crore, and EBITDA margin increased by 77 basis points to 3.2%. Gross profit rose 25.0% to Rs 1,579 crore and gross margin improved to 20.0% from 19.7%.
Sourcing remained the largest reported operating segment, with H1 FY27 revenue of Rs 7,542 crore, up 25% year on year, and earnings before interest and tax (EBIT), including other income, of Rs 175 crore at a 2.3% margin. Manufacturing revenue was Rs 452 crore, down 1%, while its EBIT was Rs 26 crore at a 5.8% margin. PDS Ventures and Others reported EBIT of negative Rs 4.9 crore, and consolidated EBIT was Rs 193 crore versus Rs 158 crore in H1 FY26.
Got a follow-up? Ask IRIS
Which PDS markets and categories contributed to growth?
The Americas was PDS's fastest-growing major geography in H1 FY27, with revenue rising 44% year on year and its revenue share increasing to 23% from 18%. Europe grew 26% and increased its share to 34% from 31%. The UK grew 1%, with its share falling to 39% from 44%, while Asia, Middle East and Others declined 24% and represented 4% of revenue against 6% a year earlier.
Essentials and Others was the fastest-growing reported category, expanding 48% in H1 FY27 and increasing its revenue share to 7% from 5%. Children Wear grew 28% and represented 24% of revenue, up from 22%; Men's Wear grew 10% and Women's Wear grew 7%. The top 10 sourcing verticals accounted for more than 75% of total topline, with revenue growth of 13.2%, profit before tax (PBT) growth of 12.6%, and a PBT margin of 4.3% versus 4.4% a year earlier.
What changed in PDS's balance sheet and working capital?
PDS moved to net cash of Rs 154 crore at September 30, 2026, from net debt of Rs 105 crore at March 31, 2026. Total debt declined to Rs 1,060 crore from Rs 1,141 crore, while cash and bank balances rose to Rs 1,214 crore from Rs 1,036 crore. The company reported net-debt-to-equity of negative 0.08 times and net-debt-to-EBITDA of negative 0.32 times.
Net working capital days moved to negative five days at September 30, 2026, from positive four days at March 31, 2026. Inventory days declined to 15 from 20, debtor days edged down to 45 from 46, and payable days increased to 67 from 61. PDS reported cash flow from operations of Rs 457 crore, return on capital employed (ROCE) of 22%, and ROCE excluding new verticals of 28%, based on trailing-12-month net capital employed.
Conclusion
PDS converted 29.6% Q2 FY27 revenue growth into faster expansion in EBITDA and profit after tax, with EBITDA up 48.7% and profit after tax up 44.2%. The first-half pattern was similar, as revenue increased 22.7%, EBITDA rose 62.3% and profit after tax grew 43.8%. Growth was led geographically by the Americas and Europe, while sourcing accounted for Rs 7,542 crore of H1 FY27 revenue.
The next result will indicate whether PDS can sustain the Q2 FY27 EBITDA margin of 3.5% and negative five working-capital days. The presentation does not disclose a future financial target or scheduled operating event, while performance within the top 10 sourcing verticals remains uneven: their aggregate PBT margin was 4.3%, and PDS Ventures and Others reported negative EBIT of Rs 4.9 crore in H1 FY27.