










Pearl Global’s operating cash flow falls to Rs 5 crore in H1FY27
Key highlights
- Pearl Global’s net cash from operating activities fell to Rs 5 crore in H1FY27 from Rs 273 crore in H1FY26.
- Working-capital days rose to 56 at September 2026 from 43 at March 2026.
- Debtor days increased to 50 from 30, while trade receivables rose to Rs 795 crore from Rs 407 crore.
- H1FY27 profit after tax increased 63.6% year on year to Rs 225 crore.
powered by IRIS
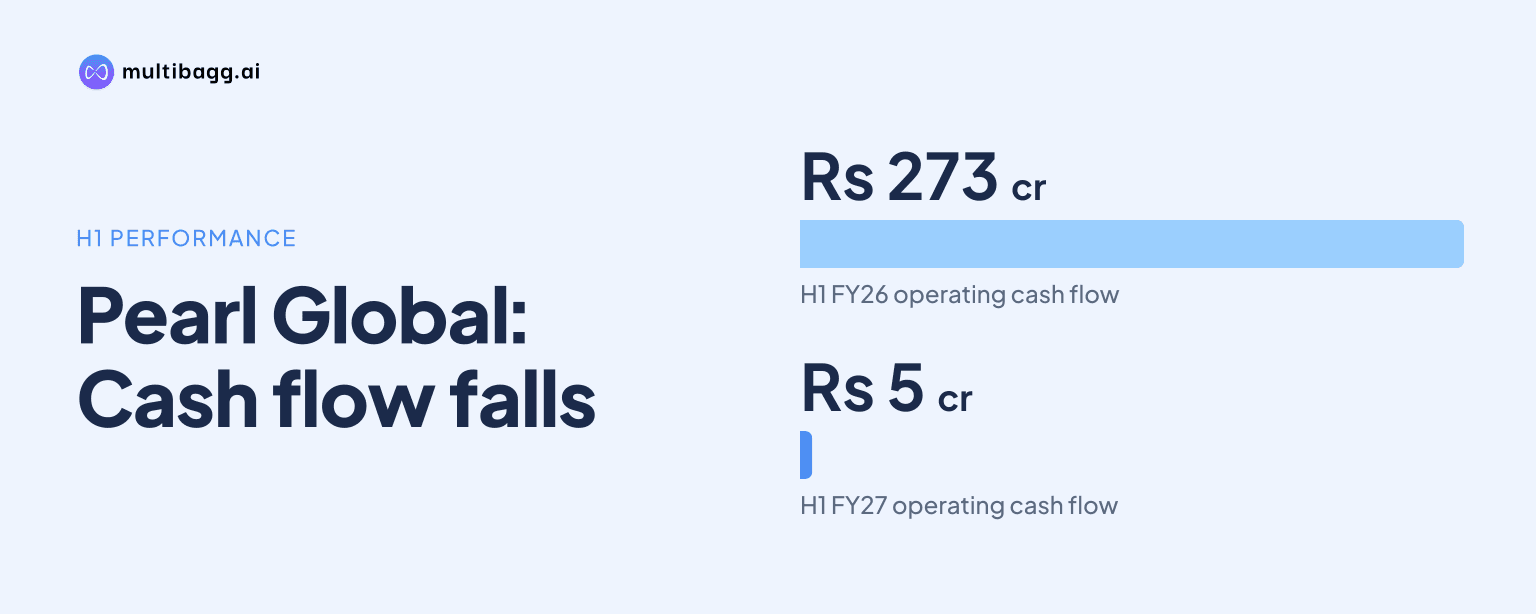
Pearl Global generated net cash from operating activities of Rs 5 crore in H1FY27, down from Rs 273 crore in H1FY26, as working-capital days rose to 56 at September 2026 from 43 at March 2026. Management attributed the cash-flow effect to year-end Christmas shipments that deferred factoring and expects normalisation in Q3/Q4.
Know Pearl Global Industries inside out
Results, valuation, peers and who's buying, in one view.
Why did Pearl Global’s operating cash flow fall in H1FY27?
Pearl Global’s operating cash flow fell because changes in working capital used Rs 360 crore in H1FY27, compared with a Rs 25 crore cash source in H1FY26. This reversal occurred even as operating profit before working-capital changes increased to Rs 389 crore from Rs 265 crore, indicating that cash absorption followed the operating-profit calculation.
Cash generated from operations consequently fell to Rs 29 crore in H1FY27 from Rs 289 crore a year earlier. After direct taxes paid of Rs 29 crore, compared with Rs 16 crore in H1FY26, and an exceptional item of Rs 5 crore, net cash from operating activities was Rs 5 crore, against Rs 273 crore in the prior-year half.
Management said heavy shipments for Christmas festivities near the end of the quarter deferred factoring, affecting both receivable days and net operating cash flow. Debtor days reached 50 at September 2026, and management did not disclose the value of factoring that was deferred.
How did Pearl Global’s working-capital cycle change?
Pearl Global’s working-capital cycle rose to 56 days at September 2026 from 43 days at March 2026 and 38 days at March 2025. The ratios are calculated on sales, while the September 2026 measures are on a trailing 12-month basis, as stated in the presentation.
The largest movement was in debtor days, which rose by 20 days to 50 at September 2026 from 30 at March 2026. Inventory days increased by two days to 66, while creditor days increased by 10 days to 61; the increase in payables partly offset, but did not eliminate, the higher cash requirement from receivables and inventory.
Management specifically linked the increase in receivable days to Christmas-festivity shipments near the end of the quarter and the resulting deferment of factoring. It expects normalisation in Q3/Q4, but the presentation gives no target for debtor days, inventory days or the total 56-day working-capital cycle.
Which balance-sheet movements absorbed Pearl Global’s cash?
Pearl Global’s trade receivables increased to Rs 795 crore at September 2026 from Rs 407 crore at March 2026, an increase of Rs 388 crore. Inventories rose by Rs 174 crore to Rs 1,056 crore over the same period, movements that coincide with the rise in debtor days to 50 and inventory days to 66.
Trade payables increased to Rs 965 crore at September 2026 from Rs 698 crore at March 2026, or Rs 267 crore. That movement corresponds with creditor days rising to 61 from 51 and partly funded the increase in current assets, which rose by Rs 583 crore to Rs 2,816 crore while current liabilities rose by Rs 478 crore to Rs 1,877 crore.
Borrowings also increased during the period. Current borrowings rose to Rs 794 crore at September 2026 from Rs 584 crore at March 2026, while non-current borrowings increased to Rs 164 crore from Rs 103 crore, taking gross debt to Rs 958 crore from Rs 687 crore. Cash and bank balance was Rs 638 crore at September 2026 under the presentation’s definition, which excludes cash earmarked for letter-of-credit payments and includes investments.
Got a follow-up? Ask IRIS
Did Pearl Global’s profit growth offset weaker cash conversion?
Pearl Global reported higher earnings in H1FY27, but the increase did not convert into comparable operating cash during the half year. Revenue from operations rose 31.1% year on year to Rs 3,330 crore, adjusted earnings before interest, tax, depreciation and amortisation (EBITDA) increased 47.7% to Rs 348 crore, and profit after tax rose 63.6% to Rs 225 crore.
Adjusted EBITDA margin increased to 10.5% in H1FY27 from 9.3% in H1FY26, while profit-after-tax margin rose to 6.8% from 5.4%. Pearl Global said H1FY27 revenue included about Rs 98 crore from value-added services, while other expenses included about Rs 96.5 crore associated with those services.
The cash-flow bridge shows why the earnings increase was insufficient to maintain cash conversion. Net profit before tax rose by Rs 98 crore to Rs 254 crore, and operating profit before working-capital changes increased by Rs 124 crore to Rs 389 crore. However, the shift in working-capital changes from a Rs 25 crore source to a Rs 360 crore use of cash was a Rs 385 crore adverse movement.
Investing and financing flows also affected cash balances in H1FY27. Net cash used in investing activities was Rs 317 crore, compared with Rs 202 crore in H1FY26, while financing activities generated Rs 158 crore after using Rs 156 crore a year earlier. Cash and cash equivalents ended H1FY27 at Rs 550 crore, down from Rs 704 crore at the beginning of the period but above Rs 426 crore at the end of H1FY26.
Conclusion
Pearl Global’s H1FY27 results show a divergence between reported earnings and cash conversion. Profit after tax rose to Rs 225 crore and adjusted EBITDA reached Rs 348 crore, yet net cash from operating activities was Rs 5 crore because working capital used Rs 360 crore. The most pronounced operating metric movement was debtor days, which rose to 50 at September 2026.
The next disclosed point to watch is management’s expectation of normalisation in Q3/Q4 after Christmas-related shipments are factored and collections progress. Subsequent results can test that expectation through movements in the 56-day working-capital cycle, trade receivables of Rs 795 crore and cash generated from operations.