










Pearl Global standalone PAT fell 30% despite H1 revenue gain
Key highlights
- Standalone H1FY27 revenue increased 22.1% to Rs 648 crore from Rs 531 crore.
- Standalone H1FY27 PAT fell 29.6% to Rs 29 crore from Rs 41 crore.
- Adjusted EBITDA margin declined to 4.9% in H1FY27 from 5.7% in H1FY26.
- Standalone operating cash flow was negative Rs 19 crore in H1FY27 versus positive Rs 73 crore in H1FY26.
powered by IRIS
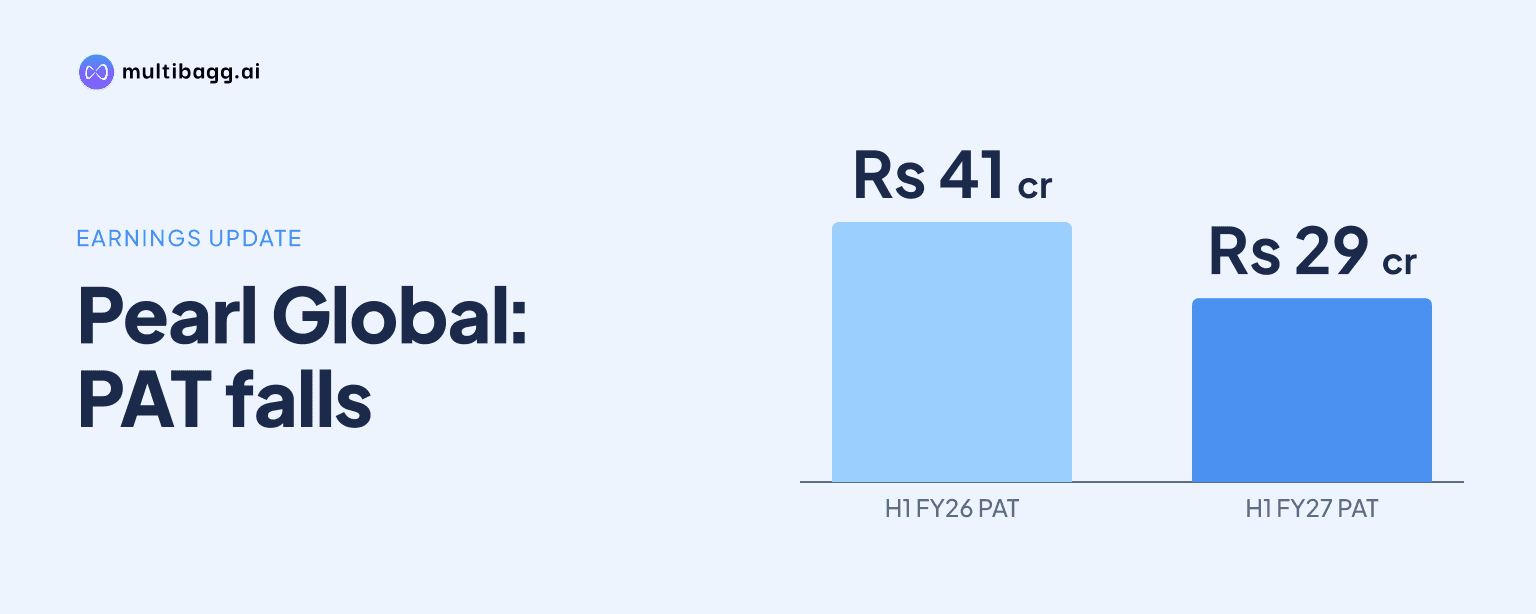
Pearl Global Industries Limited, referred to here as Pearl Global, reported standalone revenue growth of 22.1% to Rs 648 crore in the first half of financial year 2027 (H1FY27), but profit after tax (PAT) fell 29.6% to Rs 29 crore as adjusted earnings before interest, tax, depreciation and amortisation (adjusted EBITDA) margin declined to 4.9% from 5.7%.
Know Pearl Global Industries inside out
Results, valuation, peers and who's buying, in one view.
Why did Pearl Global's H1FY27 profit fall?
Pearl Global's H1FY27 profit fell because revenue growth and a higher gross margin did not offset lower other income, a lower operating margin, higher tax and a higher exceptional-item amount. Profit before tax declined 22.8% to Rs 33 crore from Rs 43 crore, and PAT declined to Rs 29 crore from Rs 41 crore. The PAT margin consequently fell to 4.4% from 7.6%.
Pearl Global said the decline was largely attributable to higher other income in H1FY26, which included approximately Rs 32 crore of dividend income. In H1FY27, reported other income was Rs 37 crore and included dividend income of Rs 22.5 crore. The year-on-year comparison therefore included a lower other-income contribution even as revenue increased by Rs 117 crore.
Profit before tax margin declined to 5.1% in H1FY27 from 8.1% in H1FY26, while earnings per share fell to Rs 3.1 from Rs 4.4. The Rs 10 crore reduction in profit before tax was smaller than the Rs 12 crore fall in PAT because tax was Rs 4 crore in H1FY27, compared with Rs 2 crore a year earlier.
How did Pearl Global's standalone margins change?
Pearl Global's gross profit margin rose, but its adjusted EBITDA, earnings before interest and tax (EBIT), and net-profit margins all declined in H1FY27. Gross profit margin increased to 57.9% from 56.0%, reflecting gross-profit growth of 26.1%, faster than the 22.1% increase in revenue. Adjusted EBITDA, which excludes employee stock option plan (ESOP) expenses, had a margin of 4.9%, down from 5.7%.
Employee cost increased to Rs 152 crore from Rs 131 crore, while other expenses rose to Rs 191 crore from Rs 136 crore. Those costs increased by a combined Rs 76 crore, compared with a Rs 78 crore increase in gross profit. As a result, adjusted EBITDA rose only Rs 2 crore to Rs 32 crore despite the Rs 117 crore revenue gain.
Below adjusted EBITDA, depreciation was unchanged at Rs 14 crore, while finance cost fell to Rs 15 crore from Rs 18 crore. Pearl Global said finance cost as a percentage of sales decreased to 2.3% from 3.4% because factoring was deferred amid heavy Christmas-festivity shipments towards the end of the quarter. Tax was Rs 4 crore in H1FY27, compared with Rs 2 crore a year earlier, and the exceptional-item line was Rs 5 crore versus Rs 1 crore.
Got a follow-up? Ask IRIS
What did Pearl Global report for Q2FY27?
Pearl Global reported a more favourable year-on-year PAT outcome in the second quarter of financial year 2027 (Q2FY27) than in the first half as a whole. Q2FY27 revenue rose 16.8% to Rs 308 crore from Rs 264 crore, while PAT increased 9.4% to Rs 16 crore from Rs 15 crore. Profit before tax rose 7.0% to Rs 16 crore from Rs 15 crore.
Operating profitability nevertheless declined in the quarter. Adjusted EBITDA fell 13.3% to Rs 9 crore from Rs 11 crore, and its margin fell to 3.0% from 4.0%. Gross profit rose 19.9% to Rs 174 crore, with gross margin increasing to 56.3% from 54.8%, but employee cost grew to Rs 75 crore from Rs 66 crore and other expenses rose to Rs 90 crore from Rs 68 crore.
Other income increased to Rs 25 crore in Q2FY27 from Rs 22 crore in Q2FY26, supporting EBIT of Rs 25 crore, compared with Rs 24 crore. Q2 PAT margin was 5.2%, compared with 5.6% a year earlier, despite the increase in absolute quarterly PAT.
What do Pearl Global's cash flow and balance sheet show?
Pearl Global's standalone operating cash flow turned negative in H1FY27 as working capital absorbed Rs 49 crore, compared with a Rs 42 crore source in H1FY26. Cash generated from operations was negative Rs 18 crore, versus positive Rs 74 crore, and net cash from operating activities was negative Rs 19 crore, compared with positive Rs 73 crore. Operating profit before working-capital changes was broadly steady at Rs 31 crore, compared with Rs 32 crore.
Cash and cash equivalents ended H1FY27 at Rs 52 crore, compared with Rs 28 crore at the end of H1FY26, although they were down from Rs 175 crore at March 2026. Net investing cash flow was negative Rs 92 crore, against negative Rs 132 crore a year earlier, while net financing cash flow was negative Rs 12 crore versus negative Rs 104 crore. The total net decrease in cash during H1FY27 was Rs 123 crore.
On the standalone balance sheet, total assets were Rs 1,180 crore at September 2026, compared with Rs 1,165 crore at March 2026. Inventories rose to Rs 217 crore from Rs 193 crore and trade receivables increased to Rs 188 crore from Rs 165 crore. Current investments were Rs 104 crore at September 2026, compared with nil at March 2026.
Current borrowings increased to Rs 305 crore at September 2026 from Rs 254 crore at March 2026, while total current liabilities rose to Rs 503 crore from Rs 474 crore. Total equity was Rs 580 crore, compared with Rs 582 crore, and total non-current liabilities declined to Rs 97 crore from Rs 109 crore.
Conclusion
Pearl Global's standalone H1FY27 accounts show a divergence between sales expansion and bottom-line performance. Revenue, gross profit and gross margin increased, but higher employee and other expenses limited adjusted EBITDA growth, while lower other income, higher tax and the exceptional-item amount reduced profit before tax and PAT. The comparison is also affected by the approximately Rs 32 crore dividend income included in H1FY26 other income.
The next point to watch is cash conversion as inventories, receivables and current borrowings all rose between March and September 2026, alongside negative Rs 19 crore operating cash flow in H1FY27. In its consolidated cash-flow commentary, Pearl Global said deferred factoring caused by heavy Christmas shipments affected operating cash flow and that it expects normalisation in Q3 and Q4.