










Piramal Finance upgrades cut new debt cost below maturities
Key highlights
- Piramal Finance raised Rs 13,327 crore of long-term debt at 8.46% in H1 FY27.
- Piramal Finance’s H1 FY27 new-debt cost was below the 9.08% cost of Rs 8,516 crore maturing in H2 FY27.
- Piramal Finance reported Rs 83,800 crore of borrowings as of September 2026, including 39% fixed-rate funding.
- Piramal Finance’s consolidated LCR was 553% at September 2026 period end, against a 100% regulatory requirement.
powered by IRIS
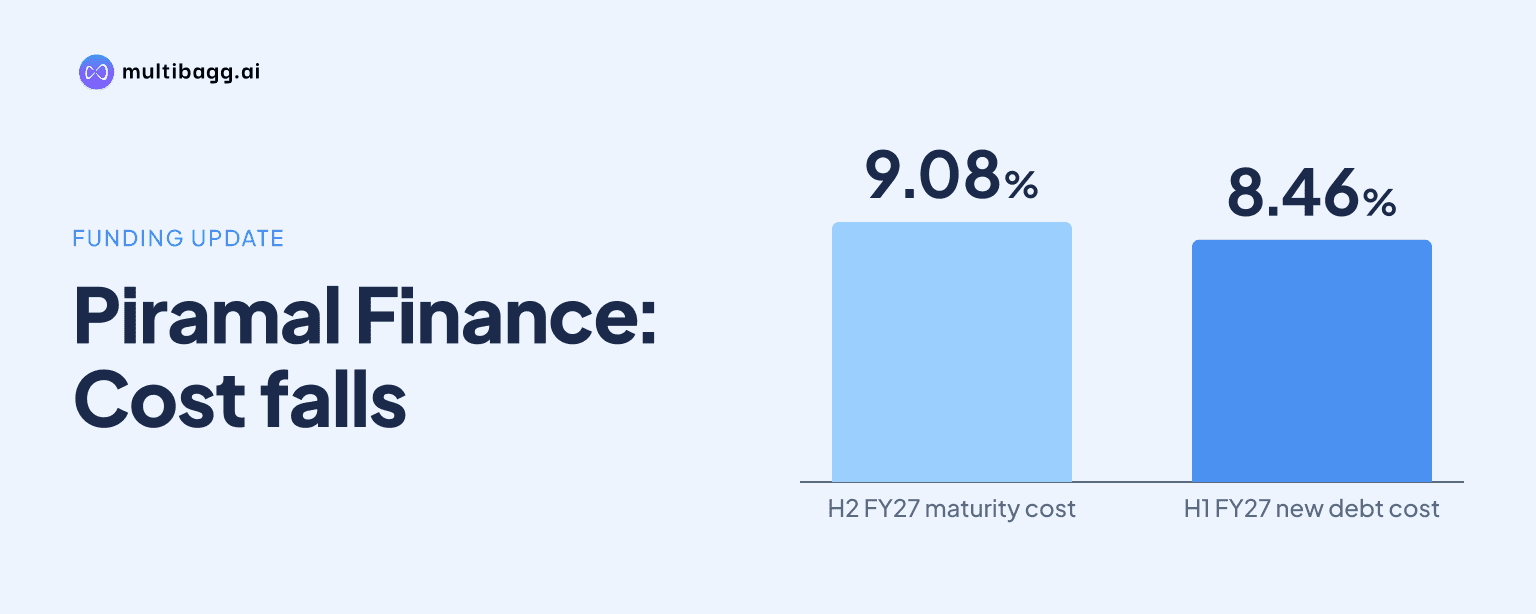
Piramal Finance raised Rs 13,327 crore of long-term debt at 8.46% in H1 FY27, below the 9.08% cost of Rs 8,516 crore maturing in H2 FY27. The company linked lower incremental borrowing costs to rating actions received from January through September 2026, while its debt-stock borrowing cost fell to 8.79% in Q2 FY27.
Know Piramal Finance inside out
Results, valuation, peers and who's buying, in one view.
How did rating actions affect Piramal Finance’s borrowing costs?
Piramal Finance said rating upgrades lowered its incremental borrowing costs. Crisil Ratings assigned AA+/Stable in January 2026, S&P Global Ratings upgraded the international rating to BB in January 2026, CareEdge Ratings upgraded the domestic rating to AA+/Stable in February 2026, and ICRA upgraded it to AA+/Stable in March 2026.
Further actions included Moody’s Ratings changing its international outlook to positive in March 2026, R&I and JCR assigning BBB/Stable in July 2026, and Moody’s Ratings upgrading Piramal Finance to Ba2/Stable in September 2026. The presentation says these actions helped reduce borrowing costs despite an upward shift in market rates.
The reported cost of long-term debt raised fell from 9.36% in H1 FY26 to 8.67% in H2 FY26 and 8.46% in H1 FY27. The H1 FY27 cost was 90 basis points below H1 FY26; one basis point is one-hundredth of a percentage point.
Piramal Finance’s H1 FY27 incremental borrowing cost was 62 basis points below the cost of H2 FY27 maturities and 61 basis points below the cost of FY28 maturities. The presentation does not specify the refinancing timing or instruments for each maturity pool.
What is Piramal Finance’s borrowing mix as of September 2026?
Piramal Finance reported Rs 83,800 crore of borrowings as of September 2026, of which 39% was fixed rate, 31% was linked to the marginal cost of funds-based lending rate, or MCLR, and 30% was linked to market rates. It described the fixed-rate portion as insulating a large share of borrowings from near-term repricing.
The company had Rs 33,000 crore of fixed-rate liabilities and Rs 51,000 crore of floating-rate liabilities, against Rs 44,000 crore of fixed-rate assets and Rs 56,000 crore of floating-rate assets. Fixed-rate assets exceeded fixed-rate liabilities by Rs 11,000 crore, while floating-rate assets exceeded floating-rate liabilities by Rs 5,000 crore.
Banks accounted for 45% of borrowings, followed by external commercial borrowings, or ECBs, at 20%. Individuals, HUFs and corporates represented 8%, while securitisation accounted for 6%, mutual funds and insurance each accounted for 5%, employee benefit and trust funding was 3%, and other lenders were 8%.
Loans made up 42% of borrowings and non-convertible debentures, or NCDs, and bonds made up 31% as of September 2026. ECBs represented 20%, securitisation 6%, commercial paper 1%, and public issues 0%, meaning loans and NCDs or bonds together comprised 73% of the funding mix.
Got a follow-up? Ask IRIS
Has Piramal Finance’s debt-stock borrowing cost declined?
Piramal Finance’s cost of borrowing, or CoB, was 8.79% in Q2 FY27, down from 8.84% in Q4 FY26 and 8.95% in both Q2 and Q3 FY26. CoB is reported as a percentage of debt, and the company described the movement as an approximately 5-basis-point decline since the rating upgrades.
The stock-level cost had previously risen from 8.64% in Q1 FY24 to 9.17% in Q3 FY25 before declining to 8.79% in Q2 FY27. That was a 38-basis-point reduction from the Q3 FY25 level, reflecting the combined effect of existing and newer borrowings rather than only incremental debt.
Cost of funds, or CoF, was 6.21% of assets under management, or AUM, in Q2 FY27, compared with 6.48% in Q2 FY26. The presentation also showed Q2 FY27 CoF at 7.0% of loans, while total income was 13.0% of AUM and net income margin was 6.8%.
What do Piramal Finance’s asset-liability gaps show?
Piramal Finance reported positive cumulative asset-liability management, or ALM, gaps across every disclosed bucket in September 2026. Inflows of Rs 5,520 crore exceeded outflows of Rs 1,034 crore in the bucket up to 14 days, producing a positive gap of 434%.
At up to one year, cumulative inflows were Rs 50,695 crore and outflows were Rs 34,591 crore, for a 47% positive gap. At up to three years, inflows of Rs 98,060 crore exceeded outflows of Rs 85,446 crore by 15%, while the gap beyond five years was 16% on inflows of Rs 167,579 crore and outflows of Rs 144,441 crore.
The period-end ALM gap value rose from Rs 8,844 crore in September 2025 to Rs 15,358 crore in March 2026 and Rs 16,103 crore in September 2026. The percentage gap increased from 28% to 51% before easing to 47%, while the rupee gap increased by Rs 7,259 crore over the year.
Piramal Finance said its ALM profile uses contractual ALM for wholesale exposures and behavioural ALM for the retail portfolio. That methodology is relevant to the September 2026 cumulative gaps, including the 18% gap in the bucket up to five years.
How much liquidity does Piramal Finance report?
Piramal Finance reported a consolidated liquidity coverage ratio, or LCR, of 553% at the September 2026 period end, compared with the 100% regulatory requirement disclosed for non-banking financial companies. The period-end LCR was 702% in September 2025 and 928% in March 2026.
The September 2026 LCR was 375 percentage points below the March 2026 level but remained 453 percentage points above the stated requirement. Piramal Finance separately reported a Q2 FY27 consolidated LCR of 442% on a period-average basis, which is distinct from the 553% period-end figure.
Conclusion
Piramal Finance’s disclosed liability data show that its 8.46% H1 FY27 incremental cost of long-term debt was below the 9.08% cost of H2 FY27 maturities and the 9.07% cost of FY28 maturities. The lower new-debt cost coincided with multiple 2026 rating actions, while CoB on the debt stock declined to 8.79% and cumulative ALM gaps remained positive.
The next disclosed measure to watch is whether refinancing continues below the 9.08% and 9.07% costs attached to maturing debt in H2 FY27 and FY28. Management’s FY27 targets include approximately 25% year-on-year AUM growth and an approximately 2.5% exit-quarter return on AUM, compared with 24% AUM growth and 2.0% annualised return on AUM in Q2 FY27.