










Piramal Finance targets 2.5% RoAUM by Q4 FY27 as costs decline
Key highlights
- Piramal Finance reported 2.0% growth-business RoAUM in Q2 FY27, versus 1.7% in Q2 FY26.
- Piramal Finance targets approximately 2.5% annualised RoAUM in Q4 FY27.
- Retail operating expenses were 3.48% of AUM in Q2 FY27, down 41 basis points year on year.
- Growth-business credit cost was 1.5% in Q2 FY27, compared with 1.7% in Q2 FY26.
powered by IRIS
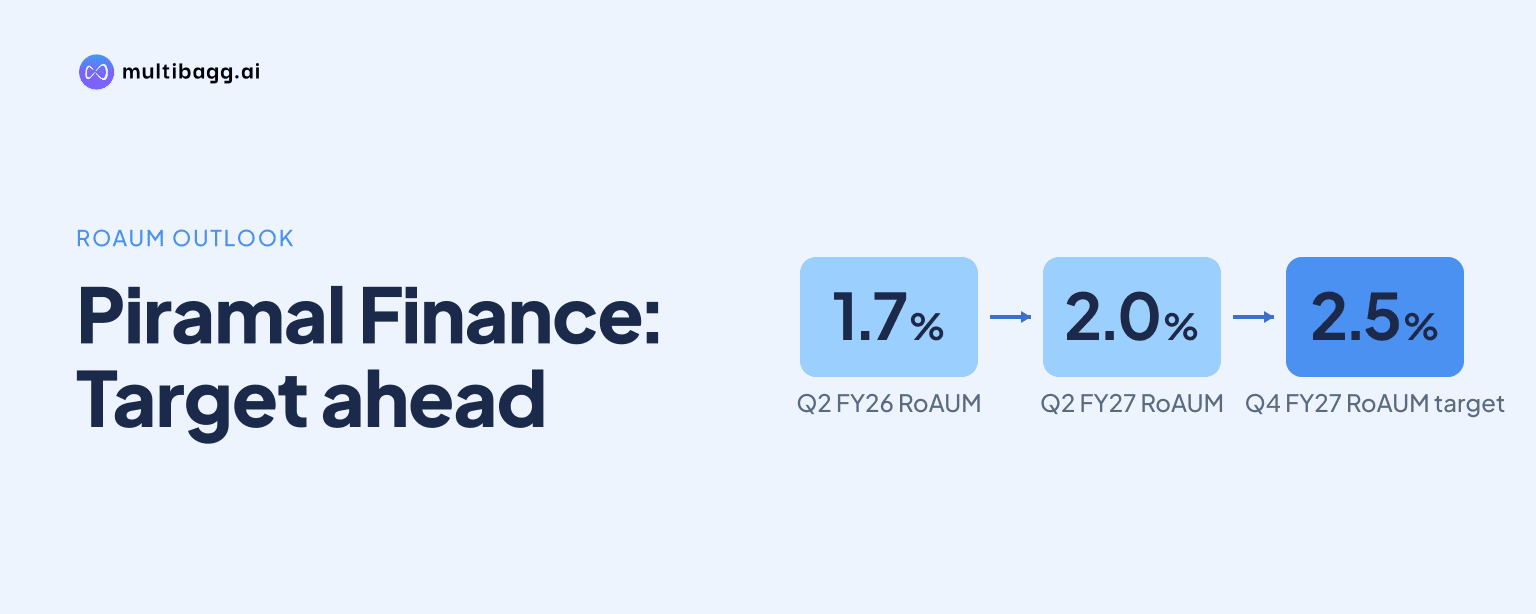
Piramal Finance reported annualised growth-business return on assets under management (RoAUM) of 2.0% in Q2 FY27 and said it was on track for an approximately 2.5% Q4 FY27 exit rate, supported by lower operating expenses and a 1.5% credit cost. The Q2 return was 34 basis points above Q2 FY26's 1.7%.
Know Piramal Finance inside out
Results, valuation, peers and who's buying, in one view.
What RoAUM is Piramal Finance targeting for FY27?
Piramal Finance is targeting annualised RoAUM of approximately 2.5% in the Q4 FY27 exit quarter, compared with 2.0% in Q2 FY27. RoAUM is defined as profit after tax (PAT) divided by average assets under management (AUM), while one basis point equals one-hundredth of a percentage point. The stated exit target is 50 basis points above the Q2 FY27 level.
The target follows a variable quarterly path in the growth business. RoAUM was 1.7% in Q2 FY26, increased to 1.9% in Q3 FY26 and 2.1% in Q4 FY26, then moved to 1.9% in Q1 FY27 before reaching 2.0% in Q2 FY27. The Q2 FY27 profitability figures use a pro forma business profit-and-loss account.
Piramal Finance also set FY27 targets of approximately 25% year-on-year total AUM growth and approximately 50% year-on-year consolidated PAT growth. In Q2 FY27, total AUM was Rs 1.13 lakh crore, up 24% year on year and 6% quarter on quarter, while PAT was Rs 545 crore, up 67% year on year.
How did Piramal Finance reach 2.0% RoAUM in Q2 FY27?
Piramal Finance reached 2.0% RoAUM as its operating-expense and credit-cost ratios declined while net income margin remained at 6.8%. Pre-provision operating profit (PPOP), which is profit before credit costs, was 3.5% of AUM in Q2 FY27. That was unchanged from Q1 FY27 and 20 basis points above the 3.3% reported in Q2 FY26.
Total income was 13.0% of AUM in Q2 FY27, down from 13.4% in Q2 FY26 and 13.1% in Q1 FY27. Cost of funds (CoF) fell more sharply, to 6.21% of AUM from 6.48% a year earlier and 6.26% in Q1 FY27. The resulting net income margin was 6.8%, unchanged quarter on quarter and 10 basis points below Q2 FY26's 6.9%.
The presentation separately gives loan-based Q2 FY27 calculations. On loans, total income was 14.2%, comprising 13.2% interest income and 1.0% retail fee income, while CoF was 7.0%. These figures have a different denominator from the AUM-based profitability ratios and should not be combined directly in a like-for-like comparison.
How much have Piramal Finance's operating costs declined?
Piramal Finance reduced retail operating expenses to 3.48% of AUM in Q2 FY27, 41 basis points below Q2 FY26 and about 300 basis points below 6.5% in Q4 FY23. Management's long-range guidance calls for a further 25-basis-point reduction in operating expenses. The growth-business operating-expense ratio was 3.2% in Q2 FY27, compared with 3.6% a year earlier and 3.3% in Q1 FY27.
The cost reduction occurred alongside retail AUM growth of 30% year on year to Rs 97,462 crore in Q2 FY27. Retail accounted for 86% of total AUM in September 2026, up from 82% in September 2025, while wholesale represented 14%, down from 18%. Housing loans were 30% of total AUM and loan against property was 27%, making them the two largest segments.
Piramal Finance reported a cost-to-income ratio of 52.1% in Q2 FY27, compared with 61.2% in Q2 FY26. Its network reached 838 branches in September 2026, including 535 urban, 203 rural and 100 gold branches. The branch count was 301 after the September 2021 DHFL merger and 14 before the merger.
Got a follow-up? Ask IRIS
Are credit costs supporting Piramal Finance's return target?
Piramal Finance reported growth-business credit cost of 1.5% in Q2 FY27, down from 1.7% in Q2 FY26 and matching Q4 FY26. Credit cost was 1.6% in Q1 FY27, so the Q2 movement reversed a 10-basis-point quarter-on-quarter increase. With PPOP at 3.5%, the company reported RoAUM of 2.0% after this credit-cost charge.
Retail loans overdue by more than 90 days, known as 90+ days past due (DPD), were 0.7% in Q2 FY27. The ratio was unchanged from Q1 FY27 and Q2 FY25, but 10 basis points above Q4 FY26's 0.6%. Across the period from Q3 FY24 through Q2 FY27, the disclosed quarterly ratio ranged between 0.6% and 0.8%.
Gross non-performing assets (GNPA) were 2.4% in Q2 FY27, compared with 2.6% in Q2 FY26. Piramal Finance describes growth-business credit cost as stable, but its FY27 target table does not state a separate credit-cost, GNPA or 90+ DPD target. The maintenance of credit costs near 1.5% is therefore an operational condition relevant to the RoAUM plan rather than a formal disclosed target.
How are funding costs affecting Piramal Finance's FY27 plan?
Piramal Finance's cost of borrowing (CoB) stock was 8.79% in Q2 FY27, compared with 8.95% in Q2 FY26 and 8.84% in Q4 FY26. The company attributes lower incremental borrowing costs to rating actions during 2026. CoB declined by 16 basis points year on year, while the AUM-based CoF ratio declined by 27 basis points to 6.21%.
The incremental cost of long-term debt raised in H1 FY27 was 8.46%, compared with 8.67% in H2 FY26. That was below the 9.08% cost of Rs 8,516 crore of debt maturing in H2 FY27 and the 9.07% cost of Rs 28,840 crore maturing in FY28. The presentation states that the lower incremental cost is intended to reduce borrowing costs at the stock level.
Borrowings were Rs 85,802 crore in Q2 FY27, up 20% year on year, while net worth was Rs 31,180 crore and debt to equity was 2.8 times. As of September 2026, 39% of borrowings were fixed rate, 31% were linked to the marginal cost of funds-based lending rate and 30% were market-rate linked. Piramal Finance also held Rs 6,899 crore of cash and equivalents, equal to 6% of assets, and reported an average liquidity coverage ratio of 442%.
Conclusion
Piramal Finance's 2.0% Q2 FY27 growth-business RoAUM reflects a 40-basis-point year-on-year decline in operating expenses to 3.2% of AUM and a 20-basis-point decline in credit cost to 1.5%. Net income margin stayed at 6.8% because total income and funding costs both fell. The company is seeking a further 50-basis-point improvement in RoAUM by Q4 FY27.
The next disclosed milestones are the Q4 FY27 exit targets of approximately 25% total AUM growth, approximately 50% consolidated PAT growth and approximately 2.5% RoAUM. Investors can track whether retail operating expenses move toward management's further 25-basis-point reduction guidance, whether credit cost remains near 1.5%, and whether new borrowing continues below the cost of maturing debt.