










Premier Energies Q2 revenue rises 43%, margin falls to 28%
Key highlights
- Premier Energies reported Q2 FY 2027 revenue from operations of Rs 2,631.852 crore, up 43.28% year on year.
- Premier Energies’ Q2 FY 2027 operational EBITDA margin was 27.96%, compared with 30.53% in Q2 FY 2026.
- Premier Energies’ net working-capital days rose to 113 in H1 FY 2027 from 77 in FY 2026.
- Premier Energies reported net debt of Rs 1,910.8 crore in Q2 FY 2027 and investing cash outflow of Rs 1,567.017 crore in H1 FY 2027.
powered by IRIS
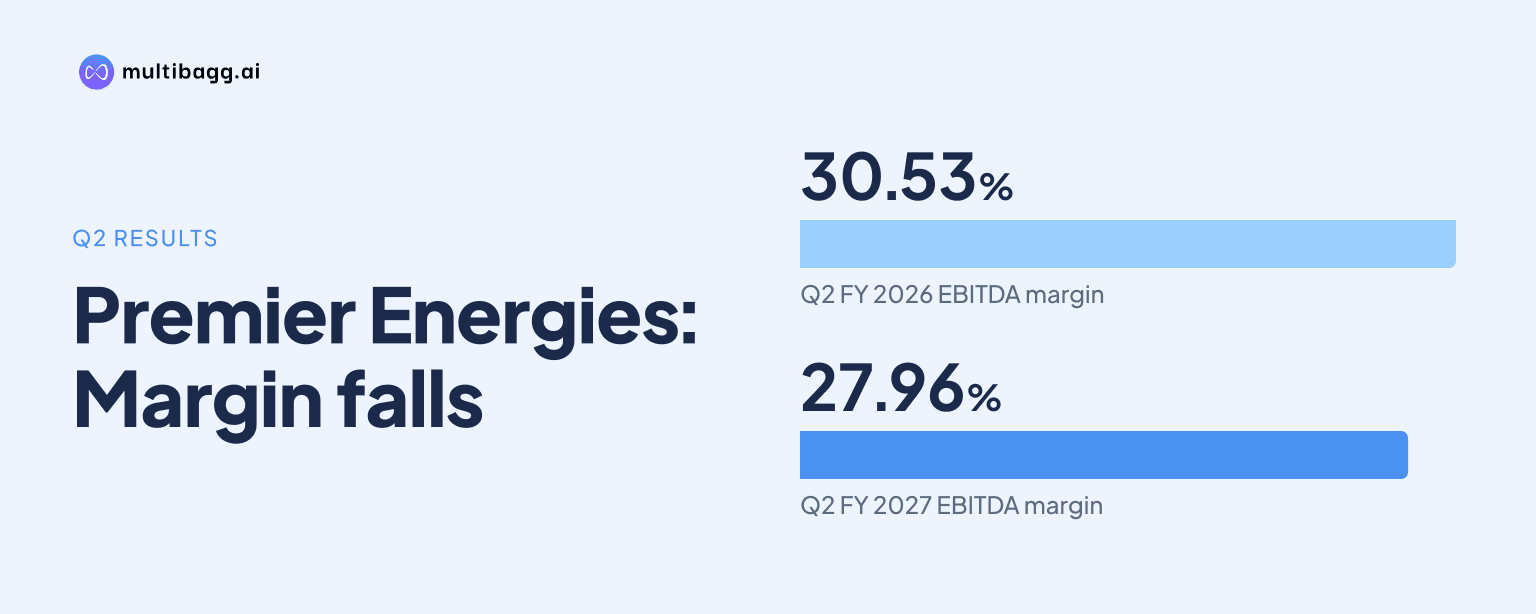
Premier Energies reported revenue from operations of Rs 2,631.852 crore in Q2 FY 2027, up 43.28% year on year, while operational EBITDA margin declined to 27.96% from 30.53%. Profit after tax rose 30.82% to Rs 462.386 crore, but net working-capital days reached 113 in H1 FY 2027 and net debt rose to Rs 1,910.8 crore.
Know Premier Energies inside out
Results, valuation, peers and who's buying, in one view.
How fast did Premier Energies grow revenue and profit in Q2 FY 2027?
Premier Energies increased revenue from operations by 43.28% year on year and 6.87% quarter on quarter to Rs 2,631.852 crore in Q2 FY 2027. Total income rose 38.24% year on year to Rs 2,656.044 crore from Rs 1,921.366 crore, although other income declined 71.37% to Rs 24.192 crore from Rs 84.501 crore.
Operational EBITDA, or earnings before interest, tax, depreciation and amortisation from operations, increased 31.18% year on year to Rs 735.761 crore. Profit after tax, or PAT, rose to Rs 462.386 crore from Rs 353.439 crore, but declined 2.02% from Rs 471.918 crore in Q1 FY 2027 despite sequential revenue growth.
Revenue increased through the five quarters shown in the presentation, from Rs 1,836.9 crore on a rounded basis in Q2 FY 2026 to Rs 2,631.9 crore in Q2 FY 2027. Operational EBITDA also rose from Rs 560.9 crore to Rs 735.8 crore over that period, while the reported operating margin moved from 30.5% to 28.0%.
Why did Premier Energies’ operating margin decline in Q2 FY 2027?
Premier Energies’ operational EBITDA margin fell by 2.57 percentage points year on year to 27.96% in Q2 FY 2027 and by 1.05 percentage points from 29.01% in Q1 FY 2027. Cost of materials consumed rose 40.71% year on year to Rs 1,787.877 crore, while employee benefits expense increased 63.91% to Rs 63.887 crore.
Sales, administration and other expenses increased 34.70% year on year to Rs 185.889 crore. Purchases of stock-in-trade were Rs 106.627 crore compared with Rs 97.386 crore a year earlier, while the inventory-change line was negative Rs 255.726 crore, compared with negative Rs 283.951 crore in Q2 FY 2026.
The reduction extended below operating profit. Consolidated EBITDA margin was 28.61%, compared with 33.59% a year earlier, while PAT margin fell to 17.41% from 18.40% in Q2 FY 2026 and 18.82% in Q1 FY 2027. Finance costs rose 30.05% year on year to Rs 42.2 crore, although they declined 3.95% sequentially from Rs 43.934 crore.
Which Premier Energies segment produced Q2 FY 2027 earnings?
Premier Energies’ Solar Cells and Modules segment generated Rs 2,509.697 crore of revenue from operations in Q2 FY 2027, compared with Rs 122.155 crore for Transformers. Solar Cells and Modules reported operational EBITDA of Rs 719.46 crore and a 28.67% margin, while Transformers recorded Rs 16.301 crore and a 13.34% margin.
Solar Cells and Modules reported PAT of Rs 452.421 crore, with a 17.87% PAT margin, whereas Transformers reported PAT of Rs 9.965 crore and an 8.03% margin. The consolidated PAT margin of 17.41% therefore reflected the larger contribution from the Solar Cells and Modules business.
Domestic sales made up 98% of Q2 FY 2027 revenue, compared with 99% in Q1 FY 2027 and Q2 FY 2026. Domestic modules accounted for 77% of revenue mix, up from 71% in Q1 FY 2027; domestic cells accounted for 18%, down from 24%; and domestic Transcon represented 4% in both quarters.
Got a follow-up? Ask IRIS
How did Premier Energies’ working capital, debt and cash change?
Premier Energies reported net working capital of 113 days in H1 FY 2027, up from 77 days in FY 2026, 72 days in FY 2025 and 83 days in FY 2024. The 36-day increase from FY 2026 coincided with current assets of Rs 6,004.814 crore and current liabilities of Rs 4,017.522 crore at H1 FY 2027.
Net debt was Rs 1,910.8 crore in Q2 FY 2027, following Rs 1,641.7 crore in Q1 FY 2027 and Rs 1,046.4 crore in Q4 FY 2026. The Q2 FY 2026 figure was negative Rs 567.3 crore. The presentation reported total debt-to-equity, or D/E, of 0.72 in September 2026.
Cash flow from operating activities was Rs 668.725 crore in H1 FY 2027, compared with Rs 619.682 crore in H1 FY 2026. Investing cash flow was negative Rs 1,567.017 crore, compared with negative Rs 157.36 crore a year earlier, while financing cash flow was negative Rs 164.823 crore and closing cash was Rs 403.409 crore.
What does Premier Energies’ H1 FY 2027 balance sheet show?
Premier Energies’ fixed assets increased to Rs 5,509.816 crore in H1 FY 2027 from Rs 3,890.531 crore at FY 2026 and Rs 1,980.027 crore in H1 FY 2026. Total assets reached Rs 12,733.165 crore, while the investing cash outflow of Rs 1,567.017 crore exceeded the Rs 668.725 crore operating cash inflow for the half year.
Shareholders’ funds rose to Rs 5,169.388 crore from Rs 4,307.716 crore at FY 2026. Non-current liabilities declined to Rs 3,269.786 crore from Rs 3,333.147 crore, while current liabilities increased to Rs 4,017.522 crore from Rs 3,201.354 crore. The presentation reported a cash-flow-from-operating-activities-to-PAT ratio of 0.72 for H1 FY 2027.
Premier Energies’ company background lists capacity expansion and an engineering, procurement and construction, or EPC, business joint venture for 2026. It lists cell capacity of 10,600 megawatts and module capacity of 11,100 megawatts for 2026, compared with 3,200 megawatts of cell capacity and 5,100 megawatts of module capacity in 2025. The financial statements do not separately allocate the H1 investing outflow across those initiatives.
Conclusion
Premier Energies delivered 43.28% year-on-year revenue growth and 30.82% PAT growth in Q2 FY 2027, but operating profitability moderated as operational EBITDA margin fell to 27.96% and PAT margin reached 17.41%. The Solar Cells and Modules segment supplied Rs 719.46 crore of operational EBITDA, compared with Rs 16.301 crore from Transformers, leaving consolidated earnings concentrated in the solar business.
The next results will show whether net working-capital days move from the 113 days reported in H1 FY 2027 and how cash flows develop alongside the disclosed 2026 capacity expansion and EPC joint-venture plan. Net debt, which reached Rs 1,910.8 crore in Q2 FY 2027, and the gap between operating cash flow and investing outflow remain disclosed measures to watch.