










PRO FX revenue rose Rs 66.251 crore between FY24 and FY26
Key highlights
- PRO FX revenue from operations increased from Rs 110.477 crore in FY24 to Rs 176.728 crore in FY26.
- PRO FX EBITDA margin moved from 12.6% in FY24 to 13.4% in FY25 and 11.7% in FY26.
- PRO FX reported H1 FY27 revenue of Rs 92.845 crore, up 16.99% year on year.
- PRO FX total equity increased to Rs 96.778 crore at Sep-26 from Rs 89.013 crore at Mar-26.
powered by IRIS
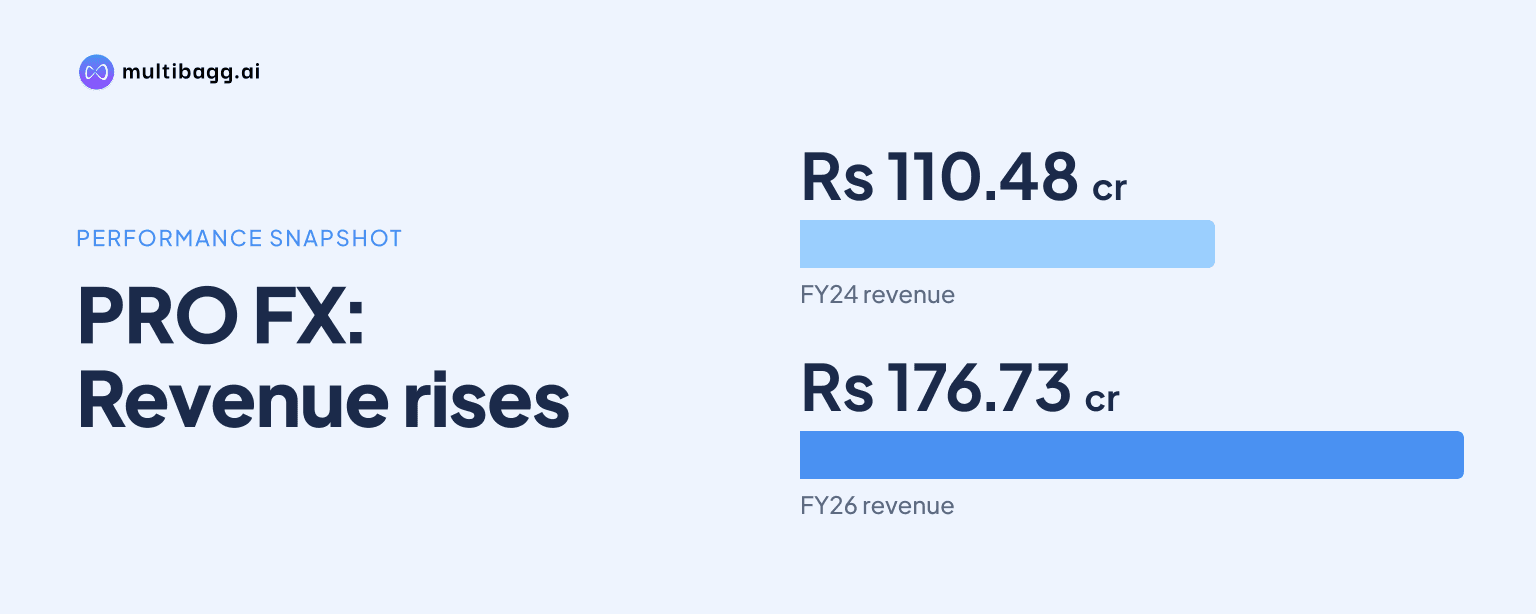
In FY26, PRO FX reported revenue from operations of Rs 176.728 crore, Rs 66.251 crore above FY24’s Rs 110.477 crore. EBITDA margin was 11.7%, versus 12.6% in FY24 and 13.4% in FY25, showing that reported sales growth was not matched by a steady margin increase.
Know Pro FX Tech inside out
Results, valuation, peers and who's buying, in one view.
How did PRO FX revenue change from FY24 to FY26?
PRO FX revenue from operations rose by Rs 66.251 crore between FY24 and FY26, reaching Rs 176.728 crore from Rs 110.477 crore. Revenue increased by Rs 18.898 crore in FY25 to Rs 129.375 crore, followed by a larger Rs 47.353 crore increase in FY26.
The presentation’s historical financials show FY26 as the highest full-year revenue reported across FY24, FY25 and FY26. H1 FY27 revenue was Rs 92.845 crore, while the consolidated income statement records Rs 79.362 crore for H1 FY26, representing the disclosed year-on-year increase of 16.99%; the H1 FY27 result covers only a half-year period.
How did PRO FX profit grow alongside sales?
PRO FX EBITDA increased by Rs 5.681 crore, from Rs 14.583 crore in FY24 to Rs 20.264 crore in FY26, while profit after tax, or PAT, rose by Rs 5.734 crore to Rs 15.171 crore. These increases accompanied revenue growth of Rs 66.251 crore over the same two-year span.
Both reported profit measures rose in each full year shown. EBITDA moved from Rs 14.583 crore in FY24 to Rs 17.275 crore in FY25 and Rs 20.264 crore in FY26, while PAT increased from Rs 9.437 crore to Rs 12.238 crore and then Rs 15.171 crore.
In H1 FY27, EBITDA was Rs 11.193 crore, up 14.23% from Rs 9.799 crore in H1 FY26, and PAT was Rs 8.063 crore, up 10.17% from Rs 7.319 crore. Revenue grew faster at 16.99% in that half year, based on the consolidated income statement’s reported comparisons.
Why did PRO FX margins fluctuate?
PRO FX EBITDA margin fluctuated between 11.7% and 13.4% from FY24 through H1 FY27 rather than increasing in line with revenue. The margin was 12.6% in FY24, rose to 13.4% in FY25, fell to 11.7% in FY26 and was 12.1% in H1 FY27.
PAT margin followed a similar pattern at a lower level, moving from 8.9% in FY24 to 9.5% in FY25, 8.6% in FY26 and 8.7% in H1 FY27. Thus, FY26 delivered the highest full-year PAT of Rs 15.171 crore, but FY25 recorded the highest PAT margin of 9.5%.
The detailed H1 income statement puts EBITDA margin at 12.06% in H1 FY27, compared with 12.35% in H1 FY26, a decline of 20 basis points. PAT margin was 8.68% versus 9.22%, while finance cost increased to Rs 54.8 lakh from Rs 9.7 lakh and profit before tax rose to Rs 10.679 crore from Rs 9.519 crore.
Got a follow-up? Ask IRIS
What does H1 FY27 indicate for PRO FX?
PRO FX reported H1 FY27 revenue of Rs 92.845 crore and PAT of Rs 8.063 crore, compared with Rs 79.362 crore and Rs 7.319 crore, respectively, in H1 FY26. Purchases of stock-in-trade rose to Rs 76.574 crore from Rs 63.042 crore, while employee benefits expense increased to Rs 7.541 crore from Rs 6.263 crore.
Changes in inventories of stock-in-trade were negative Rs 8.879 crore in H1 FY27, compared with negative Rs 6.003 crore in H1 FY26. Other expenses were Rs 6.416 crore against Rs 6.261 crore, alongside EBITDA of Rs 11.193 crore and the reported EBITDA margin of 12.06%.
Other income was Rs 67 lakh in H1 FY27, compared with Rs 4.8 lakh a year earlier, while depreciation and amortisation rose to Rs 63.7 lakh from Rs 23 lakh. The presentation reports earnings before interest and tax, or EBIT, of Rs 11.227 crore in H1 FY27 versus Rs 9.617 crore in H1 FY26, with EBIT margins of 12.09% and 12.12%, respectively.
How did PRO FX working capital and cash change?
PRO FX total assets rose to Rs 129.224 crore at Sep-26 from Rs 112.033 crore at Mar-26, while total equity increased to Rs 96.778 crore from Rs 89.013 crore. The historical financials also show net worth of Rs 96.778 crore for H1 FY27, compared with Rs 89.013 crore for FY26.
Inventories increased to Rs 50.78 crore at Sep-26 from Rs 41.902 crore at Mar-26, and trade receivables rose to Rs 35.404 crore from Rs 28.301 crore. Cash and cash equivalents declined to Rs 20.596 crore from Rs 30.803 crore, while trade payables increased to Rs 14.648 crore from Rs 9.806 crore.
The cash-flow statement reports net cash used in operating activities of Rs 9.287 crore in the Sep-26 column, compared with Rs 10.171 crore used in the Mar-26 column. Working-capital changes were negative Rs 17.675 crore and negative Rs 23.744 crore, respectively; because the presentation labels the cash-flow columns by dates, it does not specify whether these are directly comparable reporting periods.
Conclusion
PRO FX expanded annual revenue from Rs 110.477 crore in FY24 to Rs 176.728 crore in FY26, and both EBITDA and PAT increased across each of the three full years shown. The margin record was less consistent: EBITDA margin rose to 13.4% in FY25 before falling to 11.7% in FY26, while PAT margin declined from its 9.5% FY25 level to 8.6%.
The next disclosed period to watch is the remainder of FY27 after H1 revenue of Rs 92.845 crore and PAT of Rs 8.063 crore. The presentation also leaves inventory at Rs 50.78 crore, receivables at Rs 35.404 crore and cash at Rs 20.596 crore at Sep-26, alongside negative operating cash flow of Rs 9.287 crore in the Sep-26 column.