










R Systems’ nine-month adjusted EBITDA margin rises to 20.1%
Key highlights
- R Systems’ January-to-September 2026 revenue rose 27.7% to Rs 1,791.7 crore.
- R Systems’ adjusted EBITDA increased 49.7% to Rs 360.9 crore in January to September 2026.
- R Systems’ adjusted EBITDA margin expanded 296 basis points year on year to 20.1%.
- R Systems’ Q3 2026 adjusted EBITDA margin was 20.2%, up 329 basis points year on year.
powered by IRIS
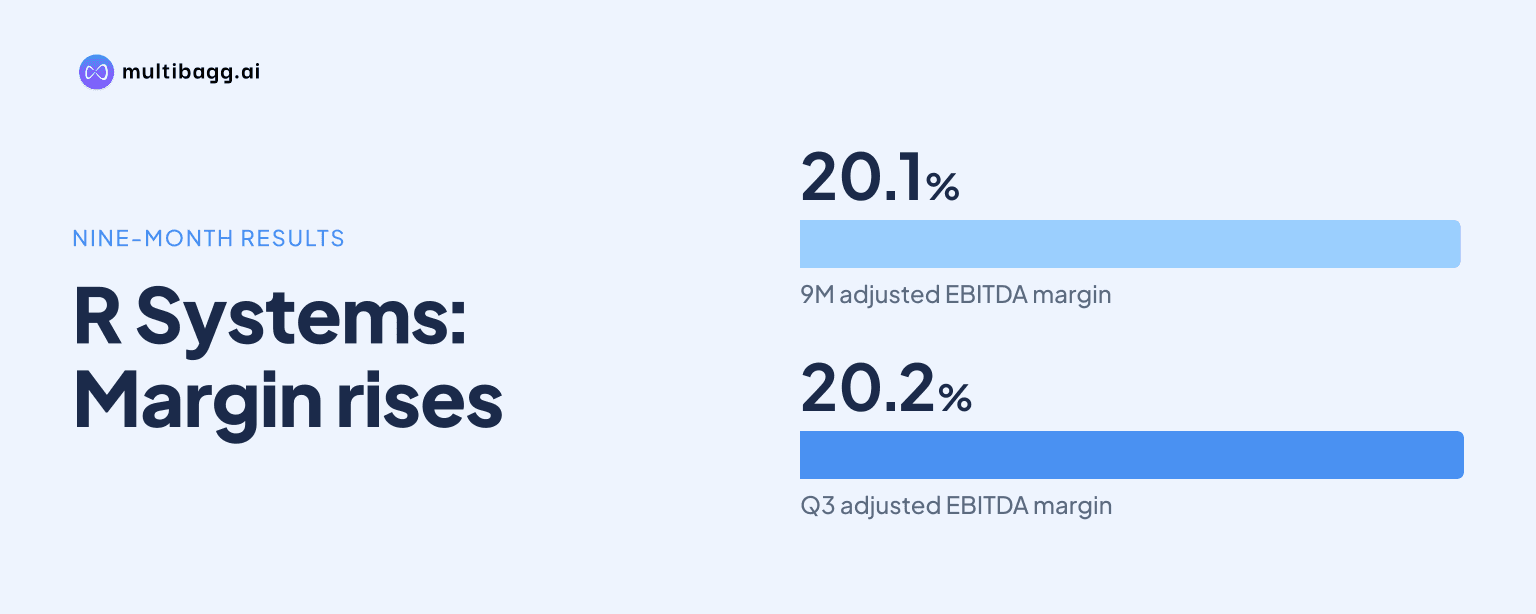
R Systems reported a 20.1% adjusted EBITDA margin for January to September 2026, up 296 basis points year on year, as revenue rose 27.7% to Rs 1,791.7 crore and adjusted EBITDA increased 49.7% to Rs 360.9 crore. The presentation attributes the EBITDA increase to Rs 41.2 crore from operations and Rs 78.7 crore from exchange impact.
Know R Systems International inside out
Results, valuation, peers and who's buying, in one view.
How did R Systems perform in January to September 2026?
R Systems grew revenue, adjusted EBITDA and adjusted net profit faster than its January-to-September 2025 base. Revenue rose from Rs 1,403.1 crore to Rs 1,791.7 crore, a 27.7% increase, while adjusted EBITDA rose from Rs 241 crore to Rs 360.9 crore, or 49.7%. The difference in growth rates lifted the adjusted EBITDA margin from 17.2% to 20.1%, an increase of 296 basis points.
R Systems reported adjusted net profit of Rs 205.1 crore for January to September 2026, up 54.0% from Rs 133.2 crore a year earlier. Adjusted net profit margin was listed as 11.4% in the detailed comparison, against 9.5% in January to September 2025, while adjusted basic earnings per share, or EPS, rose 53.8% to Rs 17.3 from Rs 11.3. R Systems defines adjusted EBITDA as excluding restricted stock unit, or RSU, expenses and non-recurring costs.
Why did R Systems’ adjusted EBITDA grow faster than revenue?
R Systems’ adjusted EBITDA increased by Rs 119.9 crore year on year, with the company’s bridge assigning Rs 41.2 crore to operations and Rs 78.7 crore to exchange impact. These two bridge items add to the movement from Rs 241 crore of adjusted EBITDA in January to September 2025 to Rs 360.9 crore in January to September 2026. The presentation does not provide a further operational cost breakdown.
The resulting 20.1% margin was above R Systems’ 17.5% adjusted EBITDA margin for full-year calendar 2025. However, the 2026 figure covers nine months, whereas the calendar-2025 figure covers a full year, so the periods are not like-for-like in duration. Calendar-year 2025 adjusted EBITDA was Rs 342.7 crore on revenue of Rs 1,958.2 crore, compared with Rs 360.9 crore on nine-month 2026 revenue of Rs 1,791.7 crore.
R Systems’ adjusted profit measures also have specified exclusions and an accounting consideration. Adjusted net profit and adjusted basic EPS exclude RSU expense and non-recurring items net of tax; the presentation additionally says they reflect the adoption of cash flow hedge accounting under Indian Accounting Standard 109, or Ind AS 109, effective 1 January 2026. That disclosure matters when comparing the 54.0% increase in adjusted net profit and the 53.8% rise in adjusted EPS with the prior-year period.
Got a follow-up? Ask IRIS
How did R Systems’ third quarter compare with prior periods?
R Systems reported Rs 615.2 crore of revenue and Rs 124.4 crore of adjusted EBITDA in Q3 2026, producing a 20.2% adjusted EBITDA margin. Compared with Q3 2025, revenue increased 23.4% from Rs 498.6 crore and adjusted EBITDA increased 47.4% from Rs 84.4 crore. The margin therefore increased from 16.9% by 329 basis points, broadly matching the nine-month expansion.
Sequentially, Q3 2026 revenue rose 2.2% from Rs 601.7 crore in Q2 2026, while adjusted EBITDA increased 3.1% from Rs 120.7 crore. The margin moved by 16 basis points from 20.1% to 20.2%. R Systems’ quarterly EBITDA bridge shows a Rs 3.3 crore operations decrease between Q2 and Q3, offset by a Rs 7 crore exchange impact, resulting in the Rs 3.7 crore net EBITDA increase.
Q3 adjusted net profit was Rs 66.5 crore, up 53.1% from Rs 43.4 crore a year earlier and 5.7% from Rs 62.9 crore in Q2 2026. Its margin reached 10.8%, versus 8.7% in Q3 2025 and 10.5% in Q2 2026. Adjusted basic EPS rose to Rs 5.6 from Rs 3.7 year on year and from Rs 5.3 sequentially.
What operating indicators accompanied R Systems’ margin expansion?
R Systems’ actual utilization improved to 82.2% in Q3 2026 from 81.1% in Q2 2026, although it remained just below the 82.3% recorded in Q3 2025. The quarterly series shows utilization had fallen to 80.4% in Q1 2026 before recovering over the following two quarters. The presentation labels the utilization data as actual and does not state a numerical desired-utilization target.
Receivables indicators were mixed but stable sequentially in billed days. Days sales outstanding, or DSO, for billed revenue was 55 days in Q3 2026, unchanged from Q2 2026 and below 57 days in Q3 2025. DSO including billed and unbilled revenue was 76 days, one day above Q2 2026 and equal to Q3 2025. The presentation states these operating metrics are trailing-twelve-month measures and exclude the new Novigo acquisition.
Geographically, the Americas remained R Systems’ largest revenue region at 70.6% in Q3 2026, down from 71.5% in Q2 2026. Asia-Pacific increased to 16.0% from 15.3%, Europe declined to 9.4% from 9.7%, and the Middle East and Africa rose to 4.0% from 3.6%. Client concentration changed little: the top 10 clients represented 24.4% of revenue in both quarters, while the top client’s share decreased from 6.0% to 5.8%.
Conclusion
R Systems’ January-to-September results show adjusted EBITDA and adjusted net profit growing faster than revenue, with adjusted EBITDA margin reaching 20.1% from 17.2% a year earlier. The Rs 119.9 crore increase in adjusted EBITDA combined an Rs 41.2 crore operational contribution with a Rs 78.7 crore exchange impact, while Q3 maintained a 20.2% margin after 20.1% in Q2.
The next updates will need to clarify whether recent contract wins translate into revenue, as R Systems disclosed Q3 engagements in telecom modernization, data platforms, lending technology, Salesforce and payment operations without revenue values or delivery timetables. Trailing-12-month annual contract value, or ACV, bookings excluding renewals were unchanged at $82.9 million in Q2 and Q3 2026 after rising from $74.0 million in Q3 2025.