










Ravelcare H1 profit nearly doubles as gross margin reaches 79.9%
Key highlights
- Ravelcare reported H1 FY27 profit after tax of Rs 3.84 crore, up 96.6% from H2 FY26.
- Revenue from operations reached Rs 15.15 crore in H1 FY27, a 20.7% sequential increase.
- Gross margin rose to 79.9%, up 190 bps sequentially and 350 bps year on year.
- Ravelcare reported Rs 26.60 crore of cash, deposits and investments and nil debt at 30 September 2026.
powered by IRIS
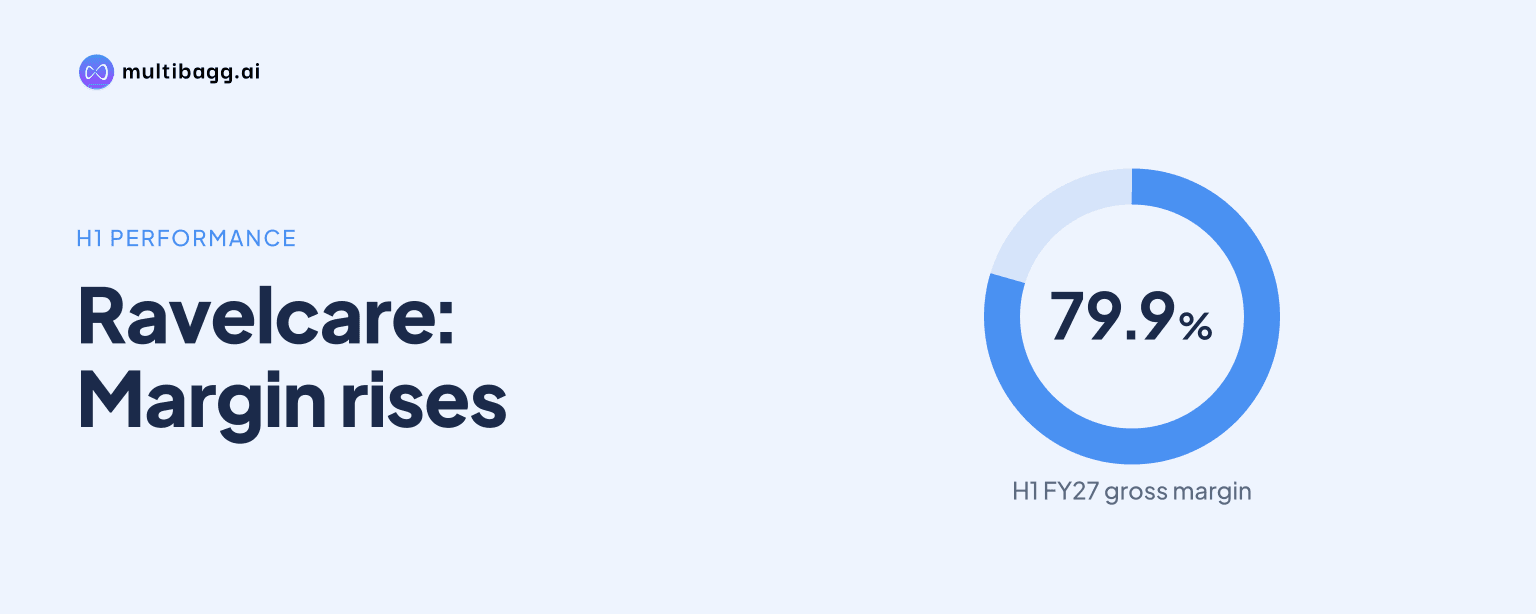
Ravelcare Limited’s H1 FY27 profit after tax rose 96.6% from H2 FY26 to Rs 3.84 crore, while gross margin reached 79.9%. Revenue from operations increased 20.7% to Rs 15.15 crore, other expenses fell to 45.7% of revenue from 53.2%, and other income rose to Rs 72.2 lakh. The H1 FY27 figures are unaudited and subject to limited review.
Know Ravelcare inside out
Results, valuation, peers and who's buying, in one view.
Why did Ravelcare’s H1 FY27 profit rise 96.6%?
Ravelcare’s profit after tax nearly doubled sequentially because earnings grew faster than revenue while other expenses declined as a share of sales. Revenue from operations increased by Rs 2.59 crore, from Rs 12.56 crore in H2 FY26 to Rs 15.15 crore in H1 FY27. Over the same period, other expenses fell by 7.5 percentage points to 45.7% of revenue from 53.2%.
Earnings before interest, tax, depreciation and amortisation, or EBITDA, rose 64.3% to Rs 4.48 crore from Rs 2.73 crore. Profit before tax increased 89.4% to Rs 5.17 crore from Rs 2.73 crore, and profit after tax increased 96.6% to Rs 3.84 crore from Rs 1.95 crore. The progression shows profit growth outpaced the 20.7% increase in revenue at each reported earnings level.
Other income also contributed to the increase in pre-tax profit, rising to Rs 72.2 lakh in H1 FY27 from Rs 3.7 lakh in H2 FY26. It was also above the Rs 4.6 lakh recorded in H1 FY26. The presentation specifically identifies higher gross margin and higher other income as factors helping the 19.8% year-on-year increase in profit after tax.
How did Ravelcare’s revenue and margins compare across periods?
Ravelcare recorded its highest displayed half-year revenue and profit in H1 FY27, but growth was faster against H2 FY26 than against H1 FY26. Revenue of Rs 15.15 crore was 5.2% above Rs 14.40 crore in H1 FY26, compared with the 20.7% increase from Rs 12.56 crore in H2 FY26. Profit after tax was 19.8% above Rs 3.20 crore in H1 FY26 and 96.6% above the preceding half.
Gross margin was 79.9% in H1 FY27, up 190 basis points, or bps, from 78.0% in H2 FY26 and 350 bps from 76.4% in H1 FY26. Management said gross margin was not affected by the ongoing war and improved through a period of global supply-chain disruption. The H1 FY27 figure was the highest of the three displayed half-year periods.
EBITDA margin improved sequentially to 29.6% from 21.7% in H2 FY26, an increase of 780 bps. However, it was 50 bps below the 30.1% reported in H1 FY26, even though EBITDA increased 3.4% year on year to Rs 4.33 crore from Rs 4.48 crore. Gross-margin expansion therefore did not result in a higher EBITDA margin than in the same half a year earlier.
Got a follow-up? Ask IRIS
What operating changes supported Ravelcare’s H1 FY27 result?
Ravelcare said its website and consultation-module revamp improved conversion and raised average order value by 9% in H1 FY27. Management also said returns fell by around 60% compared with H2 FY26, while repeat purchases on its platform held at around 35%. These operating metrics are management estimates and are unaudited.
Ravelcare launched its PRO range for marketplaces, quick commerce and distribution channels during H1 FY27. The range went live on Amazon, Flipkart, Nykaa, Blinkit and Myntra, and management said it was sold through multiple warehouses on those platforms. More than 90% of Ravelcare’s business still came from its own website during the half.
The website changes, lower returns and 9% increase in average order value occurred alongside the reduction in other expenses to 45.7% of revenue from 53.2% in H2 FY26. The presentation does not quantify the revenue contribution from the PRO range or each marketplace. It instead describes these channels as opening additional places to sell while the company’s own website remained its main sales source.
What does Ravelcare’s balance sheet show after H1 FY27?
Ravelcare reported cash, deposits and investments of Rs 26.60 crore at 30 September 2026 and nil debt. Cash, deposits and investments increased from Rs 26.07 crore at 31 March 2026, while net worth rose to Rs 41.25 crore from Rs 37.41 crore. The 30 September 2026 figures are unaudited and the 31 March 2026 figures are audited.
Trade receivables rose to Rs 8.65 crore at 30 September 2026 from Rs 7.11 crore at 31 March 2026. Inventories declined to Rs 1.38 crore from Rs 1.52 crore, while capital work-in-progress was unchanged at Rs 2.48 crore on both dates. These movements were reported for the period in which revenue from operations reached Rs 15.15 crore.
Ravelcare reported earnings per share, or EPS, of Rs 5.59 in H1 FY27 on 68.59 lakh shares. This compared with Rs 3.48 in H2 FY26 and Rs 6.40 in H1 FY26, when the presentation identifies 50.05 lakh shares as pre-IPO. The change in share count means the EPS comparison differs from the 19.8% year-on-year increase in profit after tax.
Conclusion
Ravelcare’s H1 FY27 result combined a 20.7% sequential increase in revenue with a 96.6% rise in profit after tax. Lower other expenses relative to revenue, a 79.9% gross margin and other income of Rs 72.2 lakh accompanied the result, which was the highest displayed half-year revenue and profit in the presentation. EBITDA margin nonetheless remained 50 bps below H1 FY26.
The next disclosed development is the planned launch of Ravelcare’s personalised skincare range by December. Management also plans to continue building distribution for the PRO range across Amazon, Flipkart, Nykaa, Blinkit and Myntra, while more than 90% of business remains on its own website. The reported contribution of those newer channels remains unresolved in the presentation.