










RBZ Jewellers assets rise to Rs 716.3 crore in H1 FY27
Key highlights
- RBZ Jewellers reported total assets of Rs 716.3 crore in H1 FY27, compared with Rs 486 crore at FY26.
- Inventory increased by Rs 187.4 crore to Rs 523.1 crore in H1 FY27.
- Total liabilities increased to Rs 391.1 crore, including Rs 190.2 crore of current borrowings.
- Reported net debt-to-equity declined to 0.39 times in H1 FY27 from 0.46 times at FY26.
powered by IRIS
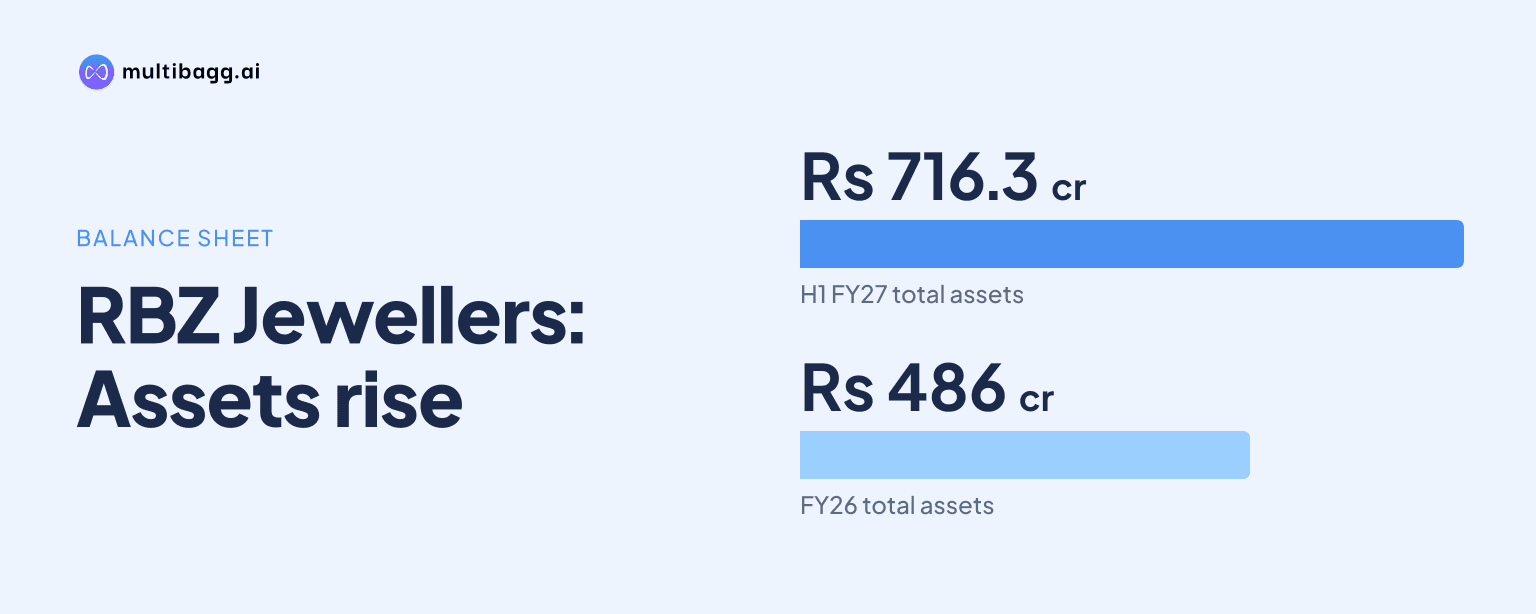
RBZ Jewellers Limited reported total assets of Rs 716.3 crore in H1 FY27, compared with Rs 486 crore at FY26, led by inventory of Rs 523.1 crore and accompanied by total liabilities of Rs 391.1 crore. The company reported net debt-to-equity of 0.39 times in H1 FY27, against 0.46 times at FY26.
Know RBZ Jewellers inside out
Results, valuation, peers and who's buying, in one view.
How did RBZ Jewellers’ assets change in H1 FY27?
RBZ Jewellers’ total assets increased by Rs 230.3 crore from FY26 to H1 FY27, the first half of financial year 2027. Current assets rose to Rs 588.6 crore from Rs 396.8 crore, while non-current assets increased to Rs 127.7 crore from Rs 89.2 crore. Current assets therefore accounted for Rs 588.6 crore of the Rs 716.3 crore asset total at H1 FY27.
Inventory was the largest component of the movement, increasing by Rs 187.4 crore to Rs 523.1 crore at H1 FY27 from Rs 335.7 crore at FY26. Cash and cash equivalents increased to Rs 6.5 crore from Rs 1.1 crore, and other current assets rose to Rs 11.2 crore from Rs 1.6 crore. Trade receivables moved lower, declining to Rs 45.1 crore from Rs 55.8 crore over the same period.
The non-current asset increase included property, plant and equipment of Rs 65.4 crore at H1 FY27, compared with Rs 33.7 crore at FY26. Right-of-use assets, representing rights associated with leased assets, rose to Rs 43.6 crore from Rs 27.3 crore. Capital work-in-progress declined to Rs 6.8 crore from Rs 24.7 crore, partly offsetting the increases in property, plant and equipment and right-of-use assets.
What funded RBZ Jewellers’ asset increase?
RBZ Jewellers’ higher asset base was matched by increases in both liabilities and equity. Total liabilities rose by Rs 204.9 crore to Rs 391.1 crore at H1 FY27 from Rs 186.2 crore at FY26, while total equity increased by Rs 25.5 crore to Rs 325.3 crore. Equity share capital was unchanged at Rs 40 crore and other equity increased to Rs 285.3 crore from Rs 259.8 crore.
Current liabilities more than doubled to Rs 306.4 crore at H1 FY27 from Rs 132.8 crore at FY26. Current borrowings increased by Rs 71.8 crore to Rs 190.2 crore, while trade payables rose by Rs 80 crore to Rs 86.3 crore from Rs 6.3 crore. The H1 FY27 balance sheet also lists Rs 14.1 crore of GML, as labelled in the presentation, under current liabilities; no GML amount appears in the FY25 or FY26 columns.
Non-current liabilities increased by Rs 31.3 crore to Rs 84.7 crore at H1 FY27 from Rs 53.4 crore at FY26. Non-current borrowings rose to Rs 36.5 crore from Rs 22.5 crore and non-current lease liabilities increased to Rs 45.8 crore from Rs 28.5 crore. Current and non-current borrowings together were Rs 226.7 crore at H1 FY27, compared with Rs 140.9 crore at FY26, before the separately listed GML and lease liabilities.
Got a follow-up? Ask IRIS
Why did RBZ Jewellers’ net debt-to-equity ratio decline?
RBZ Jewellers reported net debt-to-equity of 0.39 times in H1 FY27, lower than 0.46 times at FY26 despite higher current and non-current borrowings. The presentation does not disclose its definition or calculation of net debt, so the reported ratio cannot be directly equated with the gross borrowing balances listed in the balance sheet.
The ratio had increased from 0.26 times in FY24 to 0.34 times in FY25 and 0.46 times in FY26 before declining in H1 FY27. Reported net worth rose to Rs 325.3 crore at H1 FY27 from Rs 299.8 crore at FY26. Cash and cash equivalents increased by Rs 5.4 crore to Rs 6.5 crore, while other bank balances were Rs 2.1 crore at H1 FY27.
Gross balance-sheet obligations moved differently from the reported net debt-to-equity ratio. H1 FY27 included Rs 190.2 crore of current borrowings, Rs 36.5 crore of non-current borrowings, Rs 14.1 crore of GML and Rs 46.2 crore of lease liabilities across current and non-current categories. Trade payables of Rs 86.3 crore were also above the Rs 6.3 crore reported at FY26, alongside the Rs 187.4 crore increase in inventory.
How did H1 FY27 earnings compare with balance-sheet growth?
RBZ Jewellers reported operational revenue of Rs 345.5 crore in H1 FY27, up 56.6% from Rs 220.7 crore in H1 FY26. Earnings before interest, tax, depreciation and amortisation, or EBITDA, increased 14.4% to Rs 47.1 crore from Rs 41.1 crore. As revenue increased faster than EBITDA, the EBITDA margin declined by 510 basis points, or 5.10 percentage points, to 13.6% from 18.6%.
Profit after tax was Rs 25.5 crore in H1 FY27, marginally below Rs 25.7 crore in H1 FY26. Finance cost increased 90.2% to Rs 9.8 crore from Rs 5.1 crore, while depreciation rose 95.9% to Rs 3.3 crore from Rs 1.7 crore. Profit before tax decreased 1% to Rs 34.2 crore despite the increase in operational revenue.
The H1 FY27 asset base of Rs 716.3 crore was 47.4% above the Rs 486 crore reported at FY26, whereas H1 FY27 operational revenue was Rs 345.5 crore. The presentation reported return on equity of 15.7% and return on capital employed of 21.4% for H1 FY27, compared with 20.12% and 29.10%, respectively, for FY26. These are reported ratios for a six-month period and a full financial year, respectively.
Conclusion
RBZ Jewellers ended H1 FY27 with Rs 716.3 crore of assets, principally comprising Rs 523.1 crore of inventory, funded by Rs 325.3 crore of equity and Rs 391.1 crore of liabilities. Borrowings, lease liabilities, GML and trade payables all increased from FY26, while the company’s reported net debt-to-equity ratio declined to 0.39 times.
The next disclosure will be relevant for changes in the Rs 523.1 crore inventory balance, Rs 86.3 crore of trade payables and Rs 226.7 crore of reported borrowings. The presentation provides no balance-sheet target, timetable for these items or definition of net debt, leaving the conversion of the larger asset base into revenue, cash generation and margins unresolved.