










ROX H1 FY27 revenue rose 36% as profit margins recovered
Key highlights
- ROX reported H1 FY27 revenue of Rs 143.55 crore, up 36.96% from Rs 104.81 crore in H1 FY26.
- ROX’s H1 FY27 EBITDA margin increased to 14.18% from 12.89% in H1 FY26.
- ROX’s H1 FY27 PAT was Rs 11.94 crore versus Rs 8.10 crore, and PAT margin rose to 8.24% from 7.66%.
- ROX’s annual EBITDA margin declined from 18.26% in FY24 to 14.48% in FY26.
powered by IRIS
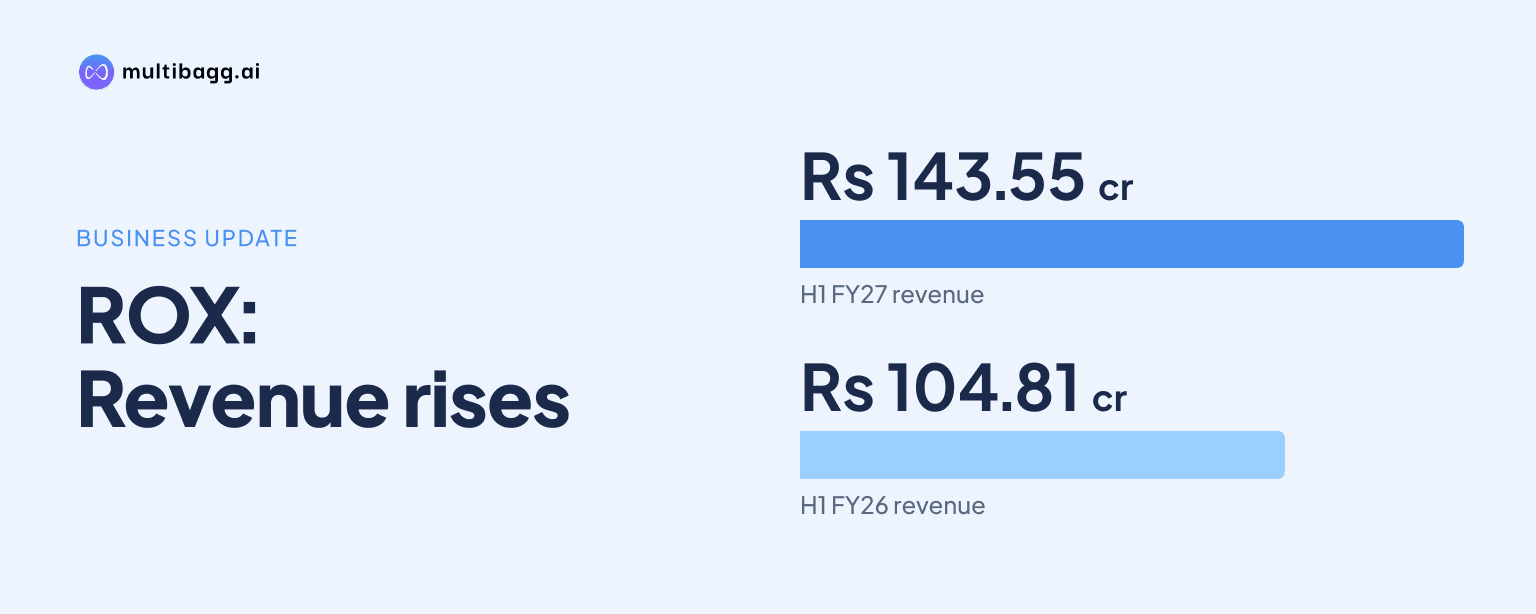
ROX Hi-Tech Limited reported H1 FY27 revenue of Rs 143.55 crore, up 36.96% from H1 FY26, while its EBITDA margin rose to 14.18% from 12.89%. The first-half outcome also lifted PAT margin to 8.24% from 7.66%, contrasting with lower annual EBITDA and PAT margins between FY24 and FY26.
Know ROX Hi-Tech inside out
Results, valuation, peers and who's buying, in one view.
How did ROX perform in H1 FY27?
ROX increased revenue by Rs 38.74 crore year on year to Rs 143.55 crore in H1 FY27, from Rs 104.81 crore in H1 FY26. Other income declined to Rs 0.80 crore from Rs 1.02 crore, but total income, comprising revenue and other income, rose by Rs 38.53 crore to Rs 144.36 crore from Rs 105.83 crore.
ROX’s earnings before interest, tax, depreciation and amortisation, or EBITDA, increased by Rs 6.83 crore to Rs 20.47 crore in H1 FY27. EBITDA grew faster than total income over the comparison, and the resulting margin increased by 1.29 percentage points to 14.18%.
Profit after tax, or PAT, rose by Rs 3.84 crore to Rs 11.94 crore from Rs 8.10 crore. Earnings per share increased to Rs 5.16 in H1 FY27 from Rs 3.55 in H1 FY26, while the PAT margin increased by 0.58 percentage points to 8.24%.
How does H1 FY27 compare with ROX’s annual profitability trend?
H1 FY27 margin expansion followed an FY24-to-FY26 period in which ROX’s annual EBITDA, EBITDA margin, PAT and PAT margin declined, even as total income increased each year. Total income rose from Rs 176.50 crore in FY24 to Rs 189.19 crore in FY25 and Rs 210.63 crore in FY26.
The change across the annual series was concentrated in profitability. EBITDA fell by Rs 1.72 crore between FY24 and FY26 despite a Rs 34.13 crore increase in total income, while EBITDA margin declined by 3.78 percentage points from 18.26% to 14.48%.
PAT declined by Rs 3.60 crore from Rs 21.24 crore in FY24 to Rs 17.64 crore in FY26. PAT margin fell by 3.67 percentage points over the same period, from 12.04% to 8.37%, whereas H1 FY27 showed year-on-year increases in both EBITDA and PAT margins.
The annual profit-and-loss statement shows finance costs rising to Rs 6.54 crore in FY26 from Rs 3.16 crore in FY24, while depreciation rose to Rs 1.71 crore from Rs 0.69 crore. Profit before tax declined to Rs 22.26 crore in FY26 from Rs 28.39 crore in FY24, alongside the EBITDA and PAT reduction.
Got a follow-up? Ask IRIS
What drove ROX’s H1 FY27 improvement in profit measures?
ROX’s total expenditure rose more slowly than total income in H1 FY27, which was the reported mechanism behind the period’s margin expansion. Total expenditure increased by Rs 31.70 crore to Rs 123.89 crore from Rs 92.19 crore, compared with a Rs 38.53 crore increase in total income to Rs 144.36 crore.
Cost of consumption, ROX’s largest H1 FY27 expense line, increased by Rs 28.57 crore to Rs 114.16 crore from Rs 85.59 crore. Employee costs rose to Rs 5.04 crore from Rs 3.13 crore and other expenses rose to Rs 4.68 crore from Rs 3.48 crore, while EBITDA increased by Rs 6.83 crore.
Below EBITDA, finance costs increased to Rs 3.87 crore in H1 FY27 from Rs 2.95 crore, and depreciation increased to Rs 1.20 crore from Rs 0.72 crore. Profit before tax nevertheless rose to Rs 15.39 crore from Rs 9.97 crore, before tax increased to Rs 3.50 crore from Rs 1.86 crore.
The FY24-to-FY26 cost pattern differed from the H1 FY27 comparison. Cost of consumption rose to Rs 154.26 crore in FY26 from Rs 133.39 crore in FY24, employee costs increased to Rs 15.30 crore from Rs 5.77 crore, and other expenses rose to Rs 10.57 crore from Rs 5.11 crore, while annual EBITDA decreased to Rs 30.51 crore from Rs 32.23 crore.
What balance-sheet and working-capital figures frame the result?
ROX ended FY26 with total assets and total liabilities of Rs 249.74 crore each, compared with Rs 204.17 crore at the end of FY25. Net worth increased to Rs 131.67 crore from Rs 109.48 crore, while current borrowings increased to Rs 65.27 crore from Rs 41.26 crore.
The FY26 balance sheet recorded inventories of Rs 69.18 crore, up from Rs 51.84 crore in FY25, while trade receivables declined to Rs 43.42 crore from Rs 55.91 crore. Cash and bank balance was Rs 27.24 crore at FY26-end, compared with Rs 27.45 crore at FY25-end; these are FY26 closing figures rather than H1 FY27 balances.
ROX reported a net working-capital cycle of 151 days in FY26, compared with 170 days in FY25 and 153 days in FY24. Inventory days increased to 164 from 137 in FY25, but receivable days fell to 76 from 144 and payable days increased to 88 from 76.
Its debt-to-equity ratio was 0.52 times in FY26, versus 0.43 times in FY25 and 0.23 times in FY24. Return on equity was 13.39% in FY26, down from 17.65% in FY25 and 22.96% in FY24, while return on capital employed was 14.36%, compared with 19.32% and 27.71%, respectively.
Conclusion
ROX’s first-half figures indicate a year-on-year improvement in operating and net-profit conversion after the annual FY24-to-FY26 series recorded falling EBITDA and PAT despite rising total income. The H1 FY27 comparison shows total income up Rs 38.53 crore, EBITDA up Rs 6.83 crore and PAT up Rs 3.84 crore from H1 FY26.
The presentation does not disclose an FY27 revenue target, profitability target, management plan or scheduled financial event. The disclosed FY26 issues to monitor alongside subsequent results are current borrowings of Rs 65.27 crore, inventory days of 164 and the 151-day net working-capital cycle.