










Runwal Q2 profit fell 94% as revenue margins contracted
Key highlights
- Runwal’s Q2 FY27 profit after tax was Rs 5.78 crore, down 93.9% year on year.
- Q2 FY27 revenue from operations declined 38.5% year on year to Rs 411.69 crore.
- Q2 FY27 EBITDA margin was 10.8%, compared with 20.2% in Q2 FY26.
- Runwal Gardens and Runwal My City contributed 62.7% of H1 FY27 revenue from operations.
powered by IRIS
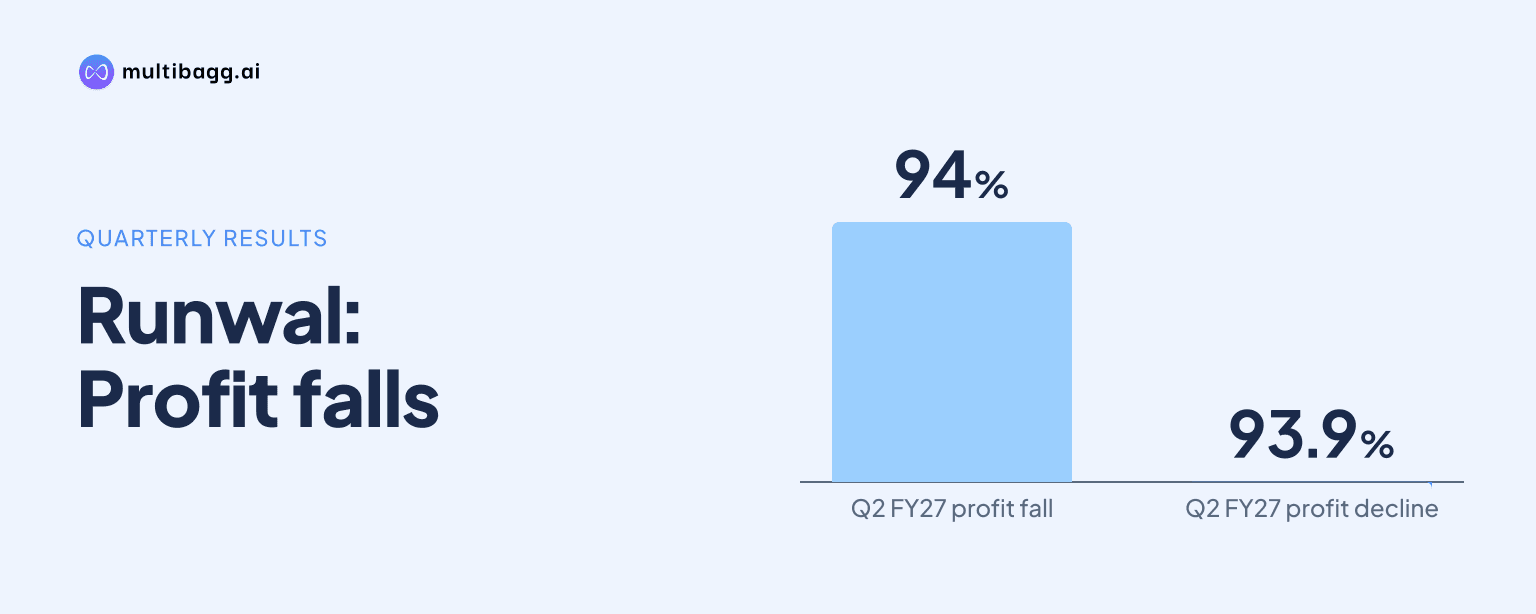
Runwal Enterprises reported Q2 FY27 profit after tax of Rs 5.78 crore, down 93.9% year on year from Rs 94.51 crore, as revenue from operations fell 38.5% to Rs 411.69 crore and EBITDA margin declined to 10.8% from 20.2%.
Know Runwal Enterprises inside out
Results, valuation, peers and who's buying, in one view.
Why did Runwal’s Q2 FY27 profit fall?
Runwal’s Q2 FY27 profit fell because revenue, gross profit and operating earnings were lower than in Q2 FY26. Revenue from operations declined by Rs 257.71 crore to Rs 411.69 crore, while gross profit fell 54.4% to Rs 104.24 crore from Rs 228.37 crore. Profit before tax decreased 82.2% to Rs 19.05 crore from Rs 107.24 crore.
The result also weakened sequentially despite higher revenue. Q2 FY27 revenue was 21.7% above Q1 FY27 revenue of Rs 338.16 crore, but profit after tax was 88.4% below Q1 FY27 profit of Rs 49.75 crore. Gross profit declined 22.3% from Rs 134.13 crore, while tax rose 4.3% year on year to Rs 13.28 crore despite the decline in profit before tax.
How did Runwal’s Q2 FY27 margins change?
Runwal’s Q2 FY27 gross margin fell to 25.3% from 34.1% in Q2 FY26, while earnings before interest, tax, depreciation and amortisation, or EBITDA, margin fell to 10.8% from 20.2%. Profit after tax margin declined to 1.4% from 14.1%. Compared with Q1 FY27, gross margin was down from 39.7%, EBITDA margin from 30.8%, and profit after tax margin from 14.7%.
The first-half comparison also showed lower reported earnings and margins. H1 FY27 revenue from operations declined 32.8% to Rs 749.85 crore, gross profit fell 40.7% to Rs 238.37 crore, and EBITDA declined 44.4% to Rs 148.93 crore. H1 FY27 profit after tax was Rs 55.53 crore, down 71.6% from Rs 195.66 crore, while gross margin decreased to 31.8% from 36.0% and EBITDA margin to 19.9% from 24.0%.
Runwal’s adjusted EBITDA, which adds project finance costs and project depreciation and amortisation charged to construction and development cost back to EBITDA, was Rs 96.32 crore in Q2 FY27. That was 53.3% below Rs 206.21 crore in Q2 FY26, and adjusted EBITDA margin fell to 23.4% from 30.8%. The reported EBITDA reduction was larger, at 67.1%, to Rs 44.62 crore.
Which projects generated Runwal’s H1 FY27 revenue?
Runwal Gardens and Runwal My City generated 62.7% of H1 FY27 revenue from operations. Runwal Gardens contributed Rs 274.9 crore, or 36.7% of the Rs 749.85 crore total, and Runwal My City contributed Rs 195.2 crore, or 26.0%. In Q2 FY27, these projects recorded revenue of Rs 211.8 crore and Rs 147.3 crore, respectively.
The five named projects in the operating-revenue subtotal generated Rs 580.1 crore, or 77.4%, of H1 FY27 revenue. Runwal Avenue contributed Rs 53.5 crore, Runwal Forests Rs 38.9 crore and Runwal Bliss Rs 17.6 crore. Sale of land classified as MMC Collection added Rs 113.2 crore for Runwal Gardens and Rs 52.7 crore for Runwal My City during Q1 FY27.
Revenue composition changed between the two quarters. The five-project operating subtotal was Rs 170.5 crore, or 50.4% of Q1 FY27 revenue, and increased to Rs 409.6 crore, or 99.5% of Q2 FY27 revenue. The Q1 project table included Rs 165.9 crore of land-sale revenue, while the Q2 table reported no land-sale revenue; other operating income was Rs 3.8 crore in H1 FY27.
Got a follow-up? Ask IRIS
How did Runwal’s sales, collections and debt change?
Runwal’s Q2 FY27 sales value increased to Rs 609.3 crore from Rs 566.6 crore in Q2 FY26, while collections rose to Rs 550.1 crore from Rs 445.3 crore. Units sold decreased to 380 from 456, and sales area declined to 0.43 million square feet from 0.45 million square feet. Average selling price increased to Rs 14,097 per square foot from Rs 12,611 per square foot, and delivered area was 0.90 million square feet against no delivery a year earlier.
For H1 FY27, sales value was Rs 1,092.8 crore versus Rs 1,026.5 crore in H1 FY26, and collections were Rs 1,125.5 crore versus Rs 944.7 crore. Sales area declined to 0.77 million square feet from 0.83 million square feet and units sold fell to 700 from 854, while average selling price rose to Rs 14,143 per square foot from Rs 12,422 per square foot. Area delivered increased to 1.90 million square feet from 0.86 million square feet.
Net debt decreased by Rs 419.3 crore during Q2 FY27 to Rs 2,364.73 crore at September 2026, while total equity increased by Rs 668.32 crore to Rs 1,565.88 crore. Net debt to equity fell to 1.51 times from 3.10 times at June 2026. The presentation attributes the equity movement mainly to conversion of compulsorily convertible debentures worth Rs 217 crore and fresh equity infusion of Rs 500 crore, less Rs 57.63 crore of issue expenses.
Conclusion
Runwal’s higher Q2 FY27 sales value and collections did not translate into higher reported earnings. Revenue from operations fell 38.5%, gross margin narrowed by 8.8 percentage points year on year and profit after tax declined to Rs 5.78 crore. The H1 FY27 outcome was similarly lower, while Runwal Gardens and Runwal My City accounted for 62.7% of first-half revenue.
The next disclosed items to watch are construction execution and scheduled project end dates. Runwal Gardens Phase 4 has end dates ranging from December 2026 to December 2027, Runwal Forests Phase 2 is scheduled for June 2027, and Runwal Avenue towers have dates ranging from June 2027 to October 2028. The September 2026 net-debt figure also included Rs 106.1 crore of construction finance and Rs 115 crore of non-convertible debt for annuity projects.